

THE NEAR-SURFACE LAYER OF THE OCEAN
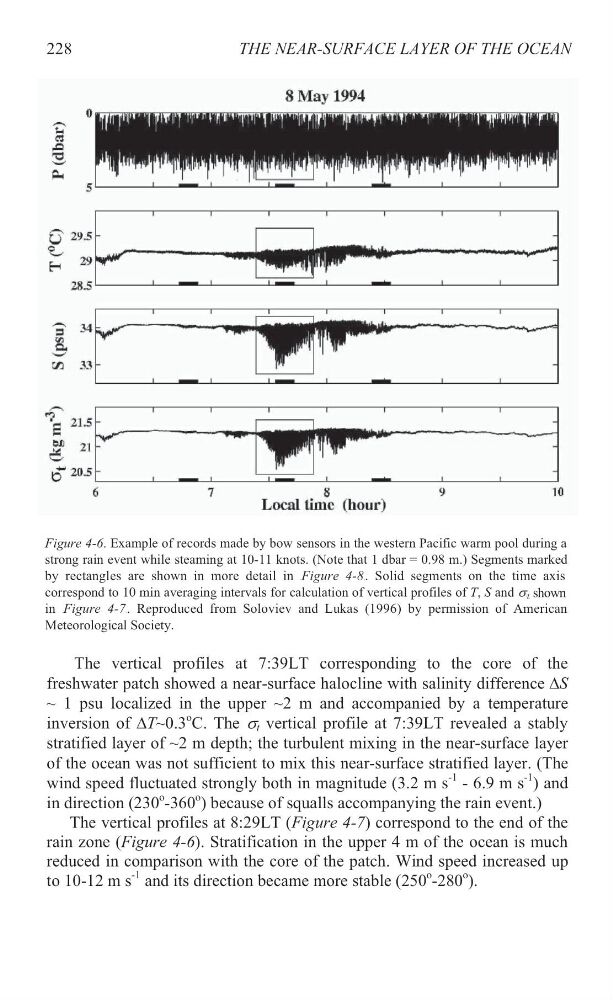
The vertical profiles at 7:39LT corresponding to the core of the
freshwater patch showed a near-surface halocline with salinity difference 'S
~ 1 psu localized in the upper ~2 m and accompanied by a temperature
inversion of 'T~0.3P
o
PC.
The VB t B vertical profile at 7:39LT revealed a stably
stratified layer of ~2 m depth; the turbulent mixing in the near-surface layer
of the ocean was not sufficient to mix this near-surface stratified layer. (The
wind speed fluctuated strongly both in magnitude (3.2 m sP
-1
P
- 6.9 m sP
-1
P)
and
in direction (230P
o
P-360P
o
P)
because of squalls accompanying the rain event.)
The vertical profiles at 8:29LT (X Figure 4-7) correspond to the end of the
rain zone (X Figure 4-6X ). Stratification in the upper 4 m of the ocean is much
reduced in comparison with the core of the patch. Wind speed increased up
to 10-12 m sP
-1
P
and its direction became more stable (250P
o
P-280P
o
P).
228
Figure 4-6. Example of records made by bow sensors in the western Pacific warm pool during a
strong rain event while steaming at 10-11 knots. (Note that 1 dbar = 0.98 m.) Segments marked
by rectangles are shown in more detail in XF igure 4-8X . Solid segments on the time axis
correspond to 10 min averaging intervals for calculation of vertical profiles of T, S and VB tB shown
in XFigure 4-7X . Reproduced from Soloviev and Lukas (1996) by permission of American
Meteorological Society.
The vertical profiles at 7:39LT corresponding to the core of the
freshwater patch showed a near-surface halocline with salinity difference 'S
~ 1 psu localized in the upper ~2 m and accompanied by a temperature
inversion of 'T~0.3P
o
PC.
The VB t B vertical profile at 7:39LT revealed a stably
stratified layer of ~2 m depth; the turbulent mixing in the near-surface layer
of the ocean was not sufficient to mix this near-surface stratified layer. (The
wind speed fluctuated strongly both in magnitude (3.2 m sP
-1
P
- 6.9 m sP
-1
P)
and
in direction (230P
o
P-360P
o
P)
because of squalls accompanying the rain event.)
The vertical profiles at 8:29LT (X Figure 4-7) correspond to the end of the
rain zone (X Figure 4-6X ). Stratification in the upper 4 m of the ocean is much
reduced in comparison with the core of the patch. Wind speed increased up
to 10-12 m sP
-1
P
and its direction became more stable (250P
o
P-280P
o
P).
228
Figure 4-6. Example of records made by bow sensors in the western Pacific warm pool during a
strong rain event while steaming at 10-11 knots. (Note that 1 dbar = 0.98 m.) Segments marked
by rectangles are shown in more detail in XF igure 4-8X . Solid segments on the time axis
correspond to 10 min averaging intervals for calculation of vertical profiles of T, S and VB tB shown
in XFigure 4-7X . Reproduced from Soloviev and Lukas (1996) by permission of American
Meteorological Society.