

THE NEAR-SURFACE LAYER OF THE OCEAN
230
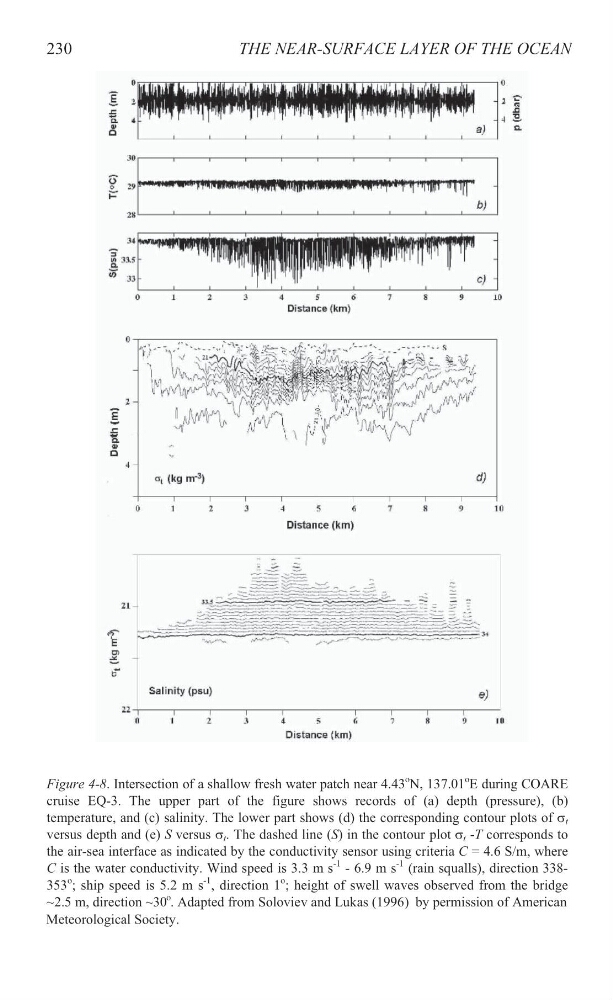
Figure 4-8. Intersection of a shallow fresh water patch near 4.43P
o
PN,
137.01P
o
PE
during COARE
cruise EQ-3. The upper part of the figure shows records of (a) depth (pressure), (b)
temperature, and (c) salinity. The lower part shows (d) the corresponding contour plots of VB t B
versus depth and (e) S versus VB t B . The dashed line (S) in the contour plot VB t B -T corresponds to
the air-sea interface as indicated by the conductivity sensor using criteria C = 4.6 S/m, where
C is the water conductivity. Wind speed is 3.3 m sP
-1
P
- 6.9 m sP
-1
P
(rain squalls), direction 338353P
o
P;
ship speed is 5.2 m sP
-1
P,
direction 1P
o
P;
height of swell waves observed from the bridge
P
o
P
~2.5 m, direction ~30 . Adapted from Soloviev and Lukas (1996) by permission of American
Meteorological Society.
230
Figure 4-8. Intersection of a shallow fresh water patch near 4.43P
o
PN,
137.01P
o
PE
during COARE
cruise EQ-3. The upper part of the figure shows records of (a) depth (pressure), (b)
temperature, and (c) salinity. The lower part shows (d) the corresponding contour plots of VB t B
versus depth and (e) S versus VB t B . The dashed line (S) in the contour plot VB t B -T corresponds to
the air-sea interface as indicated by the conductivity sensor using criteria C = 4.6 S/m, where
C is the water conductivity. Wind speed is 3.3 m sP
-1
P
- 6.9 m sP
-1
P
(rain squalls), direction 338353P
o
P;
ship speed is 5.2 m sP
-1
P,
direction 1P
o
P;
height of swell waves observed from the bridge
P
o
P
~2.5 m, direction ~30 . Adapted from Soloviev and Lukas (1996) by permission of American
Meteorological Society.