

Chapter 4: FINE STRUCTURE AND MICROSTRUCTURE
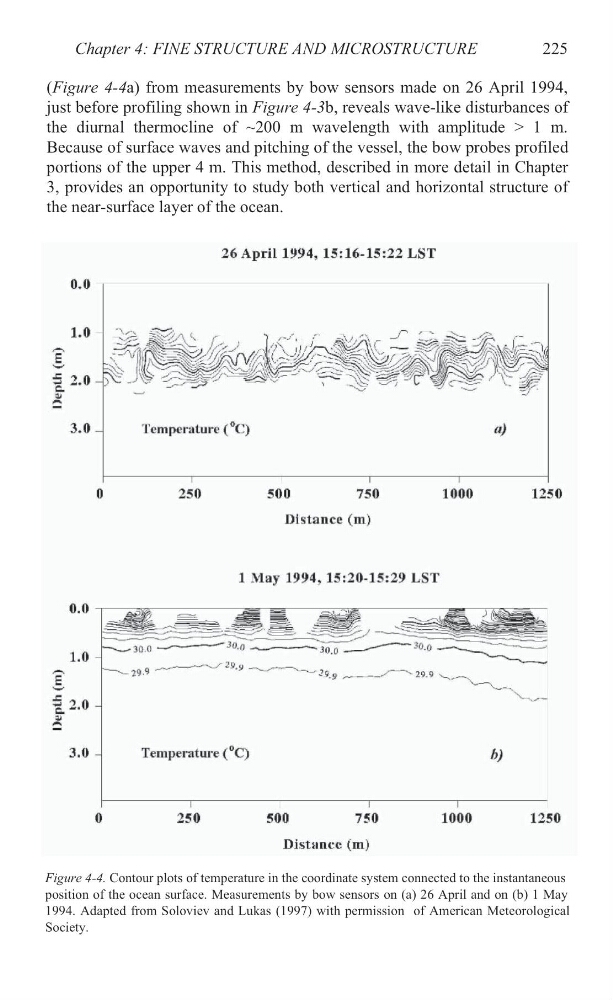
(X Figure 4-4X a) from measurements by bow sensors made on 26 April 1994,
just before profiling shown in X Figure 4-3X b, reveals wave-like disturbances of
the diurnal thermocline of ~200 m wavelength with amplitude > 1 m.
Because of surface waves and pitching of the vessel, the bow probes profiled
portions of the upper 4 m. This method, described in more detail in Chapter
3, provides an opportunity to study both vertical and horizontal structure of
the near-surface layer of the ocean.
225
Figure 4-4. Contour plots of temperature in the coordinate system connected to the instantaneous
position of the ocean surface. Measurements by bow sensors on (a) 26 April and on (b) 1 May
1994. Adapted from Soloviev and Lukas (1997) with permission of American Meteorological
Society.
(X Figure 4-4X a) from measurements by bow sensors made on 26 April 1994,
just before profiling shown in X Figure 4-3X b, reveals wave-like disturbances of
the diurnal thermocline of ~200 m wavelength with amplitude > 1 m.
Because of surface waves and pitching of the vessel, the bow probes profiled
portions of the upper 4 m. This method, described in more detail in Chapter
3, provides an opportunity to study both vertical and horizontal structure of
the near-surface layer of the ocean.
225
Figure 4-4. Contour plots of temperature in the coordinate system connected to the instantaneous
position of the ocean surface. Measurements by bow sensors on (a) 26 April and on (b) 1 May
1994. Adapted from Soloviev and Lukas (1997) with permission of American Meteorological
Society.