

THE NEAR-SURFACE LAYER OF THE OCEAN
The upper ocean is neither stationary nor horizontally homogeneous.
Moreover, the heat and momentum fluxes within the surface turbulent
boundary layer may change with depth. The Ri -type scheme, however,
adjusts to the environmental conditions on the relatively short turbulence
timescale, which substantially reduces effects of nonstationarity.
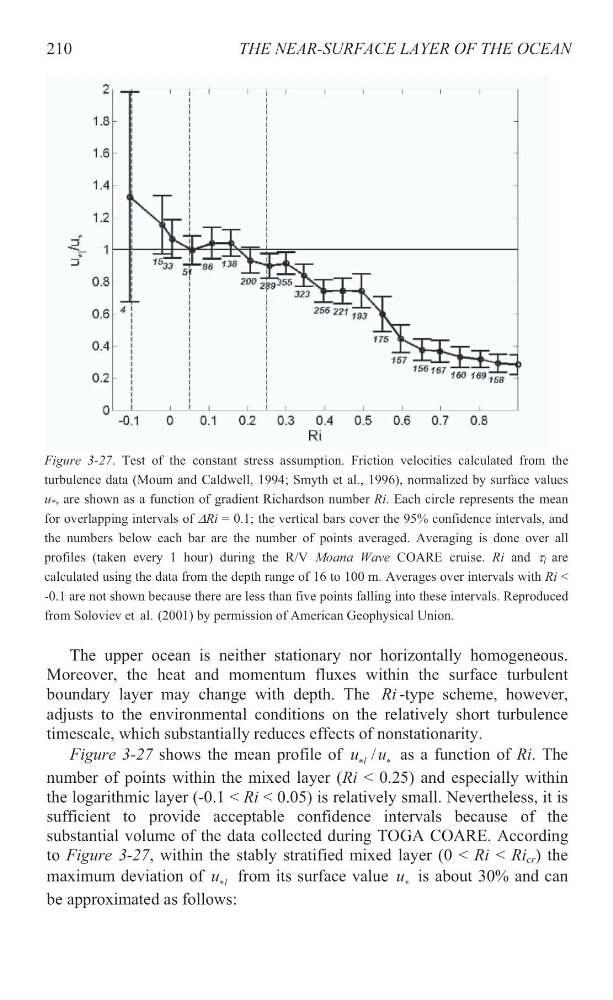
Figure 3-27 shows the mean profile of
/
l
u u
as a function of Ri. The
number of points within the mixed layer (Ri < 0.25) and especially within
the logarithmic layer (-0.1 < Ri < 0.05) is relatively small. Nevertheless, it is
sufficient to provide acceptable confidence intervals because of the
substantial volume of the data collected during TOGA COARE. According
to Figure 3-27, within the stably stratified mixed layer (0 < Ri < Ri cr ) the
maximum deviation of l
u from its surface value u is about 30% and can
be approximated as follows:
210
Figure 3-27. Test of the constant stress assumption. Friction velocities calculated from the
turbulence data (Moum and Caldwell, 1994; Smyth et al., 1996), normalized by surface values
u * , are shown as a function of gradient Richardson number Ri. Each circle represents the mean
for overlapping intervals of 'Ri = 0.1; the vertical bars cover the 95% confidence intervals, and
the numbers below each bar are the number of points averaged. Averaging is done over all
profiles (taken every 1 hour) during the R/V Moana Wave COARE cruise. Ri and W l are
calculated using the data from the depth range of 16 to 100 m. Averages over intervals with Ri <
-0.1 are not shown because there are less than five points falling into these intervals. Reproduced
from Soloviev et al. (2001) by permission of American Geophysical Union.
The upper ocean is neither stationary nor horizontally homogeneous.
Moreover, the heat and momentum fluxes within the surface turbulent
boundary layer may change with depth. The Ri -type scheme, however,
adjusts to the environmental conditions on the relatively short turbulence
timescale, which substantially reduces effects of nonstationarity.
Figure 3-27 shows the mean profile of
/
l
u u
as a function of Ri. The
number of points within the mixed layer (Ri < 0.25) and especially within
the logarithmic layer (-0.1 < Ri < 0.05) is relatively small. Nevertheless, it is
sufficient to provide acceptable confidence intervals because of the
substantial volume of the data collected during TOGA COARE. According
to Figure 3-27, within the stably stratified mixed layer (0 < Ri < Ri cr ) the
maximum deviation of l
u from its surface value u is about 30% and can
be approximated as follows:
210
Figure 3-27. Test of the constant stress assumption. Friction velocities calculated from the
turbulence data (Moum and Caldwell, 1994; Smyth et al., 1996), normalized by surface values
u * , are shown as a function of gradient Richardson number Ri. Each circle represents the mean
for overlapping intervals of 'Ri = 0.1; the vertical bars cover the 95% confidence intervals, and
the numbers below each bar are the number of points averaged. Averaging is done over all
profiles (taken every 1 hour) during the R/V Moana Wave COARE cruise. Ri and W l are
calculated using the data from the depth range of 16 to 100 m. Averages over intervals with Ri <
-0.1 are not shown because there are less than five points falling into these intervals. Reproduced
from Soloviev et al. (2001) by permission of American Geophysical Union.