

THE NEAR-SURFACE LAYER OF THE OCEAN
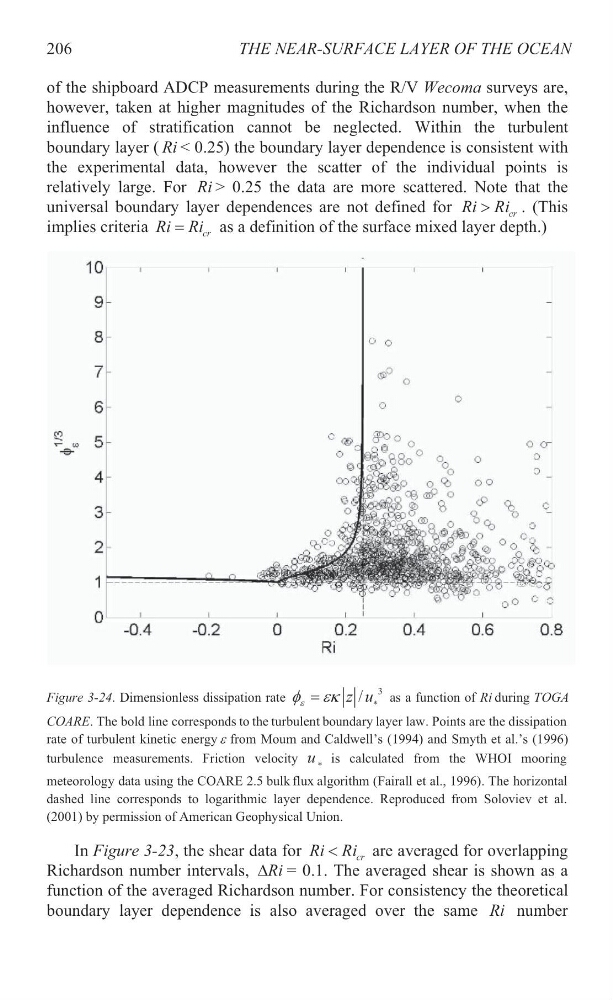
of the shipboard ADCP measurements during the R/V Wecoma surveys are,
however, taken at higher magnitudes of the Richardson number, when the
influence of stratification cannot be neglected. Within the turbulent
boundary layer ( Ri < 0.25) the boundary layer dependence is consistent with
the experimental data, however the scatter of the individual points is
relatively large. For Ri > 0.25 the data are more scattered. Note that the
universal boundary layer dependences are not defined for
cr
Ri Ri
!
. (This
implies criteria
cr
Ri Ri as a definition of the surface mixed layer depth.)
In Figure 3-23, the shear data for
cr
Ri Ri
are averaged for overlapping
Richardson number intervals, Ri
' = 0.1. The averaged shear is shown as a
function of the averaged Richardson number. For consistency the theoretical
boundary layer dependence is also averaged over the same Ri number
206
Figure 3-24. Dimensionless dissipation rate
3
/
z u
H
I HN
as a function of Ri during TOGA
COARE. The bold line corresponds to the turbulent boundary layer law. Points are the dissipation
rate of turbulent kinetic energy H from Moum and Caldwell’s (1994) and Smyth et al.’s (1996)
turbulence measurements. Friction velocity u is calculated from the WHOI mooring
meteorology data using the COARE 2.5 bulk flux algorithm (Fairall et al., 1996). The horizontal
dashed line corresponds to logarithmic layer dependence. Reproduced from Soloviev et al.
(2001) by permission of American Geophysical Union.
of the shipboard ADCP measurements during the R/V Wecoma surveys are,
however, taken at higher magnitudes of the Richardson number, when the
influence of stratification cannot be neglected. Within the turbulent
boundary layer ( Ri < 0.25) the boundary layer dependence is consistent with
the experimental data, however the scatter of the individual points is
relatively large. For Ri > 0.25 the data are more scattered. Note that the
universal boundary layer dependences are not defined for
cr
Ri Ri
!
. (This
implies criteria
cr
Ri Ri as a definition of the surface mixed layer depth.)
In Figure 3-23, the shear data for
cr
Ri Ri
are averaged for overlapping
Richardson number intervals, Ri
' = 0.1. The averaged shear is shown as a
function of the averaged Richardson number. For consistency the theoretical
boundary layer dependence is also averaged over the same Ri number
206
Figure 3-24. Dimensionless dissipation rate
3
/
z u
H
I HN
as a function of Ri during TOGA
COARE. The bold line corresponds to the turbulent boundary layer law. Points are the dissipation
rate of turbulent kinetic energy H from Moum and Caldwell’s (1994) and Smyth et al.’s (1996)
turbulence measurements. Friction velocity u is calculated from the WHOI mooring
meteorology data using the COARE 2.5 bulk flux algorithm (Fairall et al., 1996). The horizontal
dashed line corresponds to logarithmic layer dependence. Reproduced from Soloviev et al.
(2001) by permission of American Geophysical Union.