

intervals on this plot. Within the turbulent boundary layer the averaged
dissipation rates are consistent with the theoretical boundary layer
dependence, demonstrating the striking effect of increased shear at
~
0.25
cr
Ri Ri
. Some points, however, deviate from the theoretical
dependence by more than the 95% confidence interval.
Dimensionless dissipation rates are plotted as a function of the
Richardson number in Figure 3-24. Measurements made under light winds
( u < 0.3 cm s
-1 ) are excluded. The boundary layer dependence for
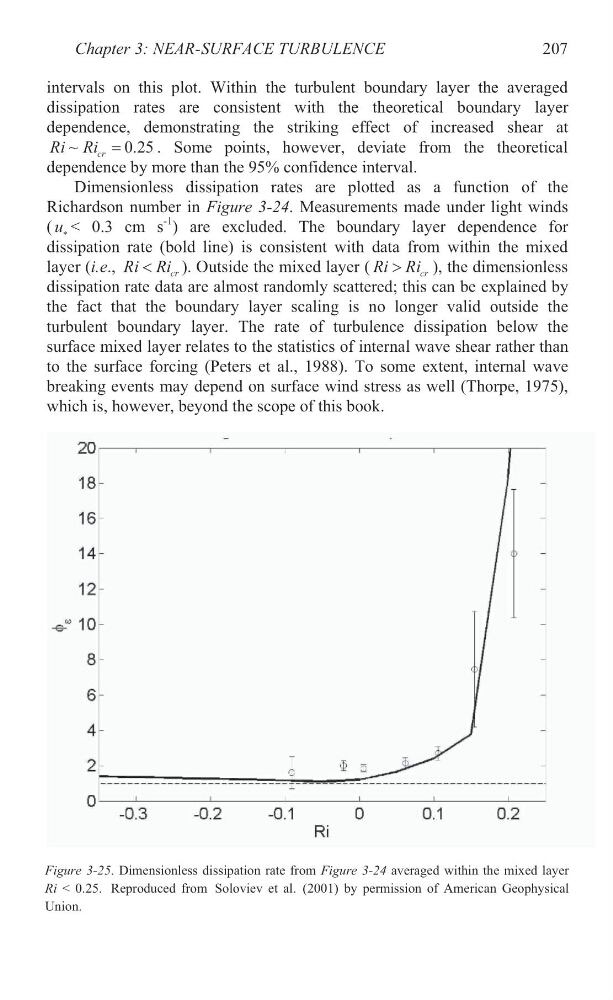
dissipation rate (bold line) is consistent with data from within the mixed
layer (i.e.,
cr
Ri Ri
). Outside the mixed layer (
cr
Ri Ri
!
), the dimensionless
dissipation rate data are almost randomly scattered; this can be explained by
the fact that the boundary layer scaling is no longer valid outside the
turbulent boundary layer. The rate of turbulence dissipation below the
surface mixed layer relates to the statistics of internal wave shear rather than
to the surface forcing (Peters et al., 1988). To some extent, internal wave
breaking events may depend on surface wind stress as well (Thorpe, 1975),
which is, however, beyond the scope of this book.
Chapter 3: NEAR-SURFACE TURBULENCE
207
Figure 3-25. Dimensionless dissipation rate from Figure 3-24 averaged within the mixed layer
Ri < 0.25. Reproduced from Soloviev et al. (2001) by permission of American Geophysical
Union.
dissipation rates are consistent with the theoretical boundary layer
dependence, demonstrating the striking effect of increased shear at
~
0.25
cr
Ri Ri
. Some points, however, deviate from the theoretical
dependence by more than the 95% confidence interval.
Dimensionless dissipation rates are plotted as a function of the
Richardson number in Figure 3-24. Measurements made under light winds
( u < 0.3 cm s
-1 ) are excluded. The boundary layer dependence for
dissipation rate (bold line) is consistent with data from within the mixed
layer (i.e.,
cr
Ri Ri
). Outside the mixed layer (
cr
Ri Ri
!
), the dimensionless
dissipation rate data are almost randomly scattered; this can be explained by
the fact that the boundary layer scaling is no longer valid outside the
turbulent boundary layer. The rate of turbulence dissipation below the
surface mixed layer relates to the statistics of internal wave shear rather than
to the surface forcing (Peters et al., 1988). To some extent, internal wave
breaking events may depend on surface wind stress as well (Thorpe, 1975),
which is, however, beyond the scope of this book.
Chapter 3: NEAR-SURFACE TURBULENCE
207
Figure 3-25. Dimensionless dissipation rate from Figure 3-24 averaged within the mixed layer
Ri < 0.25. Reproduced from Soloviev et al. (2001) by permission of American Geophysical
Union.