

from the repeated ship track observations of the R/V Wecoma during TOGA
COARE. The Richardson number was calculated from the towed undulating
CTD (SEASOAR) and ADCP gridded data (10 m in depth and ~3 km in
horizontal distance) and the formula,
2
2
/ h
Ri N S ,
(3.98)
where
2
/ /
N
g
z
U
U
' '
and
2
2
2
/
/
h
S
u z
v z
' ' ' ' . The averaging is
performed on the corresponding depth surfaces along the individual R/V
Wecoma sections. Note that the terms in the numerator and denominator of
the expression for the Richardson number are averaged separately.
The shear magnitude in Figure 3-22 is normalized with the friction
velocity calculated from the meteorological measurements with the COARE
2.5 bulk flux algorithm. There are 17 points within the Richardson number
range 0.1
0.05
Ri
that correspond to the logarithmic layer regime. Most
Chapter 3: NEAR-SURFACE TURBULENCE
205
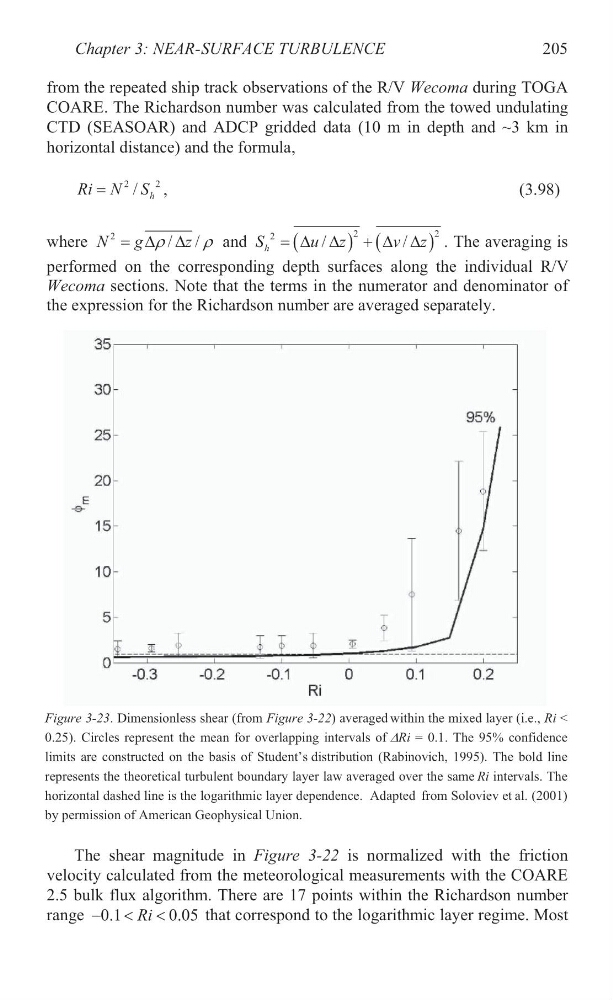
Figure 3-23. Dimensionless shear (from Figure 3-22) averaged within the mixed layer (i.e., Ri <
0.25). Circles represent the mean for overlapping intervals of 'Ri = 0.1. The 95% confidence
limits are constructed on the basis of Student’s distribution (Rabinovich, 1995). The bold line
represents the theoretical turbulent boundary layer law averaged over the same Ri intervals. The
horizontal dashed line is the logarithmic layer dependence. Adapted from Soloviev et al. (2001)
by permission of American Geophysical Union.
COARE. The Richardson number was calculated from the towed undulating
CTD (SEASOAR) and ADCP gridded data (10 m in depth and ~3 km in
horizontal distance) and the formula,
2
2
/ h
Ri N S ,
(3.98)
where
2
/ /
N
g
z
U
U
' '
and
2
2
2
/
/
h
S
u z
v z
' ' ' ' . The averaging is
performed on the corresponding depth surfaces along the individual R/V
Wecoma sections. Note that the terms in the numerator and denominator of
the expression for the Richardson number are averaged separately.
The shear magnitude in Figure 3-22 is normalized with the friction
velocity calculated from the meteorological measurements with the COARE
2.5 bulk flux algorithm. There are 17 points within the Richardson number
range 0.1
0.05
Ri
that correspond to the logarithmic layer regime. Most
Chapter 3: NEAR-SURFACE TURBULENCE
205
Figure 3-23. Dimensionless shear (from Figure 3-22) averaged within the mixed layer (i.e., Ri <
0.25). Circles represent the mean for overlapping intervals of 'Ri = 0.1. The 95% confidence
limits are constructed on the basis of Student’s distribution (Rabinovich, 1995). The bold line
represents the theoretical turbulent boundary layer law averaged over the same Ri intervals. The
horizontal dashed line is the logarithmic layer dependence. Adapted from Soloviev et al. (2001)
by permission of American Geophysical Union.