

THE NEAR-SURFACE LAYER OF THE OCEAN
enormous relative error for Ri . (Note that in definition (3.84) the shear
enters into the denominator.) Velocity measurements involve both
systematic and random errors. However, it is notable that acoustic Doppler
current profiler (ADCP) techniques provide almost unbiased shear
measurements (limited only by the effects described by Lien et al. (1994)),
thus substantially reducing the systematic error. Ensemble averaging can
significantly reduce the random error.
Shipboard ADCP instruments typically obtain measurements from the
depth range 16 m - 300 m. The boundary layer laws can be tested with this
technique only for relatively high wind speed conditions when the mixed
layer depth exceeds 20 m.
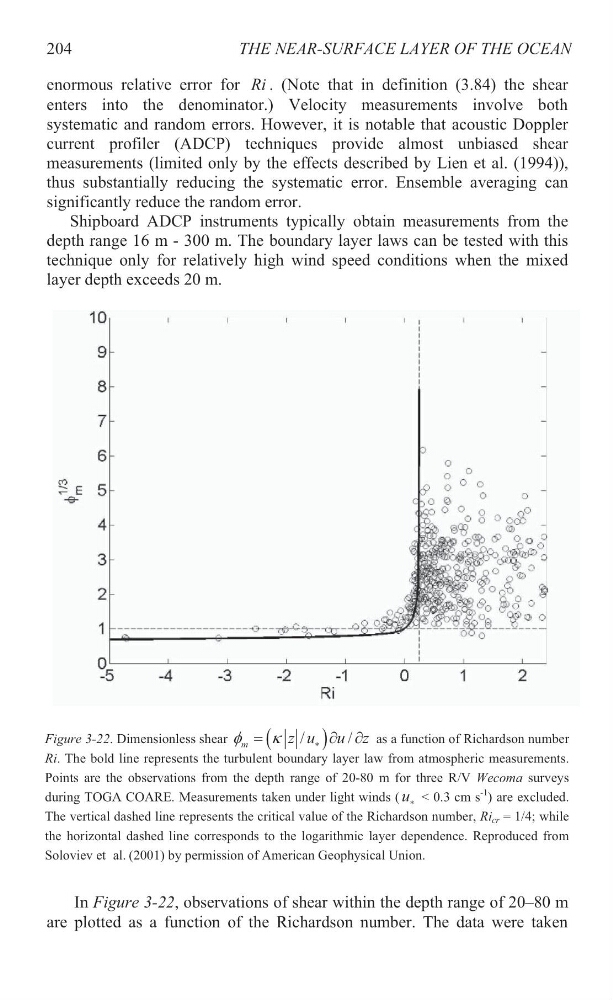
In Figure 3-22, observations of shear within the depth range of 20–80 m
are plotted as a function of the Richardson number. The data were taken
204
Figure 3-22. Dimensionless shear
/
/
m
z u u z
I
N
w w as a function of Richardson number
Ri. The bold line represents the turbulent boundary layer law from atmospheric measurements.
Points are the observations from the depth range of 20-80 m for three R/V Wecoma surveys
during TOGA COARE. Measurements taken under light winds ( u < 0.3 cm s
-1 ) are excluded.
The vertical dashed line represents the critical value of the Richardson number, Ri cr = 1/4; while
the horizontal dashed line corresponds to the logarithmic layer dependence. Reproduced from
Soloviev et al. (2001) by permission of American Geophysical Union.
enormous relative error for Ri . (Note that in definition (3.84) the shear
enters into the denominator.) Velocity measurements involve both
systematic and random errors. However, it is notable that acoustic Doppler
current profiler (ADCP) techniques provide almost unbiased shear
measurements (limited only by the effects described by Lien et al. (1994)),
thus substantially reducing the systematic error. Ensemble averaging can
significantly reduce the random error.
Shipboard ADCP instruments typically obtain measurements from the
depth range 16 m - 300 m. The boundary layer laws can be tested with this
technique only for relatively high wind speed conditions when the mixed
layer depth exceeds 20 m.
In Figure 3-22, observations of shear within the depth range of 20–80 m
are plotted as a function of the Richardson number. The data were taken
204
Figure 3-22. Dimensionless shear
/
/
m
z u u z
I
N
w w as a function of Richardson number
Ri. The bold line represents the turbulent boundary layer law from atmospheric measurements.
Points are the observations from the depth range of 20-80 m for three R/V Wecoma surveys
during TOGA COARE. Measurements taken under light winds ( u < 0.3 cm s
-1 ) are excluded.
The vertical dashed line represents the critical value of the Richardson number, Ri cr = 1/4; while
the horizontal dashed line corresponds to the logarithmic layer dependence. Reproduced from
Soloviev et al. (2001) by permission of American Geophysical Union.