

298 Pierre De Mey and Mounir Benkiran
36.50 36.75 37.00 37.25 37.50 37.75 38.00 3825 38.50 38.75 39.00 39 .25 39.50
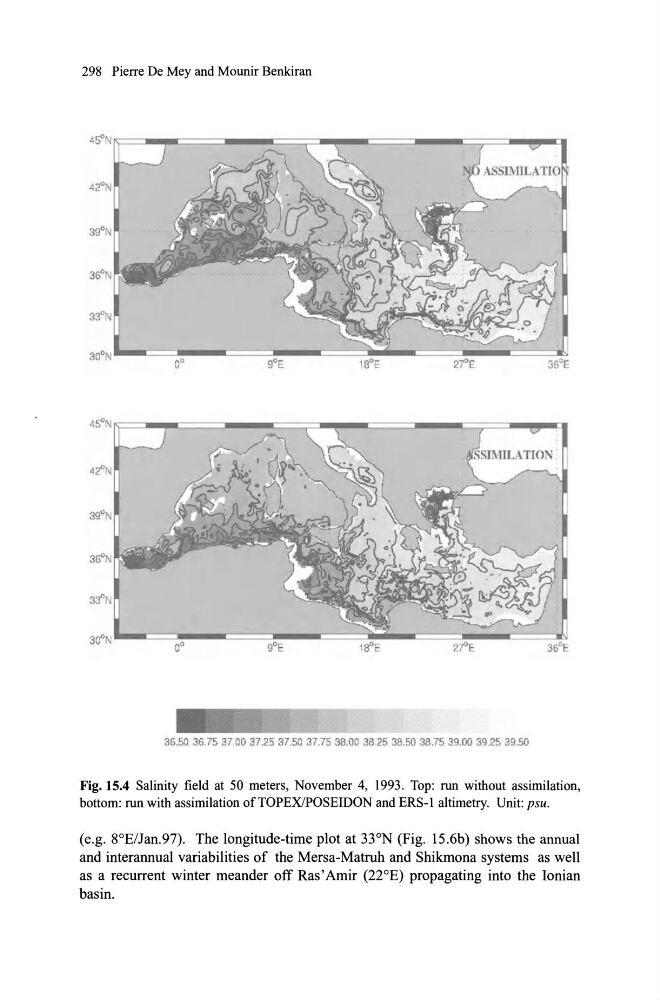
Fig. 15.4 Salinity fie\d at 50 meters, November 4, 1993. Top: run without assimilation,
bottom: run with assimilation of TOPEXlPOSEIDON and ERS-I altimetry. Unit: psu.
(e.g. 8°E/Jan.97). The longitude-time plot at 33°N (Fig. lS.6b) shows the annual
and interannual variabilities of the Mersa-Matruh and Shikmona systems as well
as a recurrent winter meander off Ras' Amir (22°E) propagating into the Ionian
basin.
36.50 36.75 37.00 37.25 37.50 37.75 38.00 3825 38.50 38.75 39.00 39 .25 39.50
Fig. 15.4 Salinity fie\d at 50 meters, November 4, 1993. Top: run without assimilation,
bottom: run with assimilation of TOPEXlPOSEIDON and ERS-I altimetry. Unit: psu.
(e.g. 8°E/Jan.97). The longitude-time plot at 33°N (Fig. lS.6b) shows the annual
and interannual variabilities of the Mersa-Matruh and Shikmona systems as well
as a recurrent winter meander off Ras' Amir (22°E) propagating into the Ionian
basin.