

Predictions in the North Sea
POL
Is.ao
14.25
13.50
12. ?S
12.0D
11.25
10.50
9. t!J
9.0D
8.251.50
6.7S
6. 00
5.15
4.50
3.15
3.00
1.25
I.SD
0.75
0,00
251
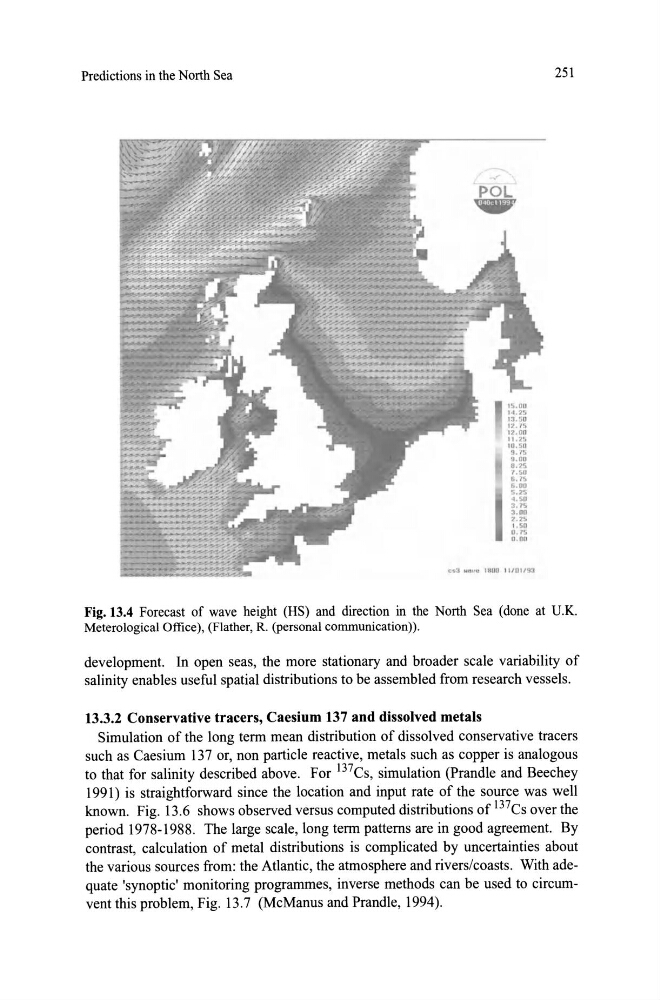
Fig. 13.4 Forecast of wave height (HS) and direction in the North Sea (done at U.K.
Meterological Oftice), (Flather, R. (personal communication)).
development. In open seas, the more stationary and broader scale variability of
salinity enables useful spatial distributions to be assembled from research vessels.
13.3.2 Conservative tracers, Caesium 137 and dissolved metals
Simulation of the long term mean distribution of dissolved conservative tracers
such as Caesium 137 or, non particle reactive, metals such as copper is analogous
to that for salinity described above. For 137Cs, simulation (Prandle and Beechey
1991) is straightforward since the location and input rate of the source was well
known. Fig. 13.6 shows observed versus computed distributions of 137Cs over the
period 1978-1988. The large scale, long term pattems are in good agreement. By
contrast, calculation of metal distributions is complicated by uncertainties about
the various sources from: the Atlantic, the atmosphere and rivers/coasts. With adequate 'synoptic' monitoring programmes, inverse methods can be used to circumvent this problem, Fig. 13 .7 (McManus and Prandle, 1994).
POL
Is.ao
14.25
13.50
12. ?S
12.0D
11.25
10.50
9. t!J
9.0D
8.251.50
6.7S
6. 00
5.15
4.50
3.15
3.00
1.25
I.SD
0.75
0,00
251
Fig. 13.4 Forecast of wave height (HS) and direction in the North Sea (done at U.K.
Meterological Oftice), (Flather, R. (personal communication)).
development. In open seas, the more stationary and broader scale variability of
salinity enables useful spatial distributions to be assembled from research vessels.
13.3.2 Conservative tracers, Caesium 137 and dissolved metals
Simulation of the long term mean distribution of dissolved conservative tracers
such as Caesium 137 or, non particle reactive, metals such as copper is analogous
to that for salinity described above. For 137Cs, simulation (Prandle and Beechey
1991) is straightforward since the location and input rate of the source was well
known. Fig. 13.6 shows observed versus computed distributions of 137Cs over the
period 1978-1988. The large scale, long term pattems are in good agreement. By
contrast, calculation of metal distributions is complicated by uncertainties about
the various sources from: the Atlantic, the atmosphere and rivers/coasts. With adequate 'synoptic' monitoring programmes, inverse methods can be used to circumvent this problem, Fig. 13 .7 (McManus and Prandle, 1994).