

Rapid Assessment of the Coastal Ocean Environment
219
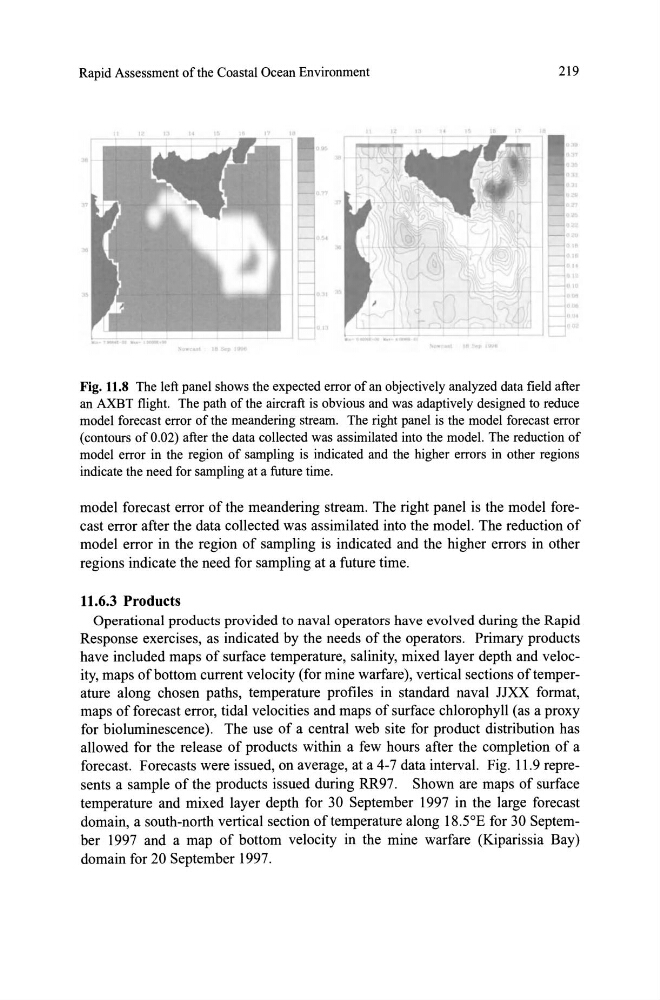
Fig. 11.8 The left panel shows the expected error of an objectively analyzed data field after
an AXBT flight. The path of the aircraft is obvious and was adaptively designed to reduce
model forecast error of the meandering stream. The right panel is the model forecast error
(contours of 0.02) after the data collected was assimilated into the model. The reduction of
model error in the region of sampling is indicated and the higher errors in other regions
indicate the need for sampling at a future time.
model forecast error of the meandering stream. The right panel is the model forecast error after the data collected was assimilated into the model. The reduction of
model error in the region of sampling is indicated and the higher errors in other
regions indicate the need for sampling at a future time.
11.6.3 Products
Operational products provided to naval operators have evolved during the Rapid
Response exercises, as indicated by the needs of the operators. Primary products
have inc\uded maps of surface temperature, salinity, mixed layer depth and velocity, maps of bottom current velocity (for mine warfare), vertical sections of temperature along chosen paths, temperature profiles in standard naval JJXX format,
maps of forecast error, tidal velocities and maps of surf ace chlorophyll (as a proxy
for bioluminescence). The use of a central web site for product distribution has
allowed for the release of products within a few hours after the completion of a
forecast. Forecasts were issued, on average, at a 4-7 data interval. Fig. 11.9 represents a sample of the products issued during RR97. Shown are maps of surf ace
temperature and mixed layer depth for 30 September 1997 in the large forecast
domain, a south-north vertical section of temperature along 18.5°E for 30 September 1997 and a map of bottom velocity in the mine warfare (Kiparissia Bay)
domain for 20 September 1997.
219
Fig. 11.8 The left panel shows the expected error of an objectively analyzed data field after
an AXBT flight. The path of the aircraft is obvious and was adaptively designed to reduce
model forecast error of the meandering stream. The right panel is the model forecast error
(contours of 0.02) after the data collected was assimilated into the model. The reduction of
model error in the region of sampling is indicated and the higher errors in other regions
indicate the need for sampling at a future time.
model forecast error of the meandering stream. The right panel is the model forecast error after the data collected was assimilated into the model. The reduction of
model error in the region of sampling is indicated and the higher errors in other
regions indicate the need for sampling at a future time.
11.6.3 Products
Operational products provided to naval operators have evolved during the Rapid
Response exercises, as indicated by the needs of the operators. Primary products
have inc\uded maps of surface temperature, salinity, mixed layer depth and velocity, maps of bottom current velocity (for mine warfare), vertical sections of temperature along chosen paths, temperature profiles in standard naval JJXX format,
maps of forecast error, tidal velocities and maps of surf ace chlorophyll (as a proxy
for bioluminescence). The use of a central web site for product distribution has
allowed for the release of products within a few hours after the completion of a
forecast. Forecasts were issued, on average, at a 4-7 data interval. Fig. 11.9 represents a sample of the products issued during RR97. Shown are maps of surf ace
temperature and mixed layer depth for 30 September 1997 in the large forecast
domain, a south-north vertical section of temperature along 18.5°E for 30 September 1997 and a map of bottom velocity in the mine warfare (Kiparissia Bay)
domain for 20 September 1997.