

218 Alian R. Robinson and Jurgen Sellschopp
ltaDid Response 97
18 August - 4 October
Inlt.l.al! 1& Aug - 3 Sep
5Ships
11 AXBT Fligbts
POEM-.AS&7
416 CTDs k XCTDs
915 XBTs k AXBT!!
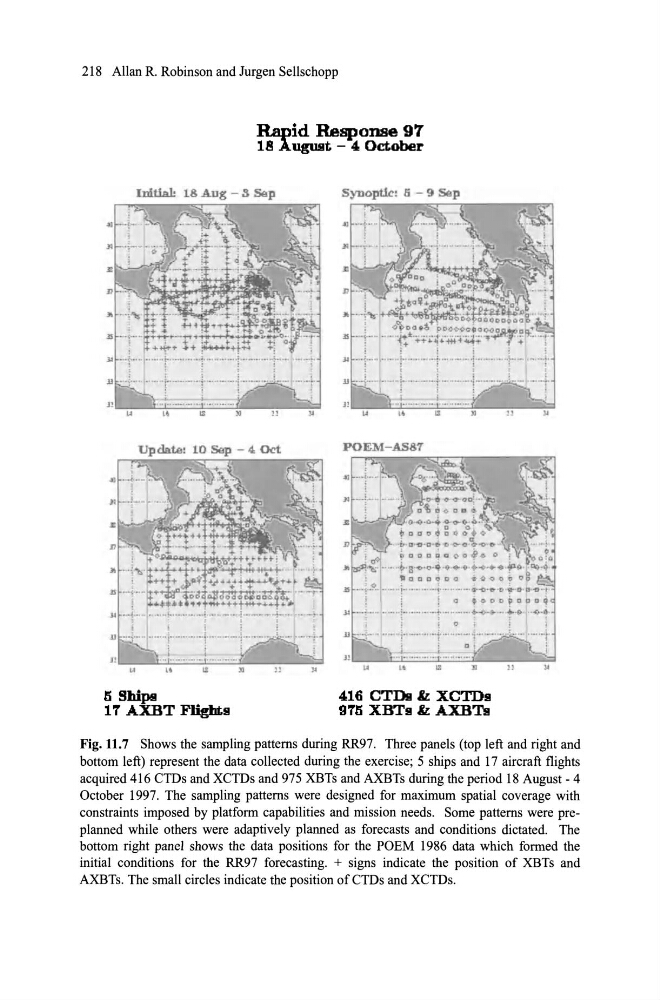
Fig.ll.7 Shows the sampling pattems during RR97. Three pane1s (top left and right and
bottom left) represent the data collected during the exercise; 5 ships and 17 aircraft flights
acquired 416 CTDs and XCTDs and 975 XBTs and AXBTs during the period 18 August - 4
October 1997. The samp1ing pattems were designed for maximum spatial coverage with
constraints imposed by platform capabi1ities and mission needs. Some pattems were preplanned whi1e others were adaptive1y p1anned as forecasts and conditions dictated. The
hottom right pane1 shows the data positions for the POEM 1986 data which formed the
initial conditions for the RR97 forecasting. + signs indicate the position of XBTs and
AXBTs. The small circles indicate the position of CTDs and XCTDs.
ltaDid Response 97
18 August - 4 October
Inlt.l.al! 1& Aug - 3 Sep
5Ships
11 AXBT Fligbts
POEM-.AS&7
416 CTDs k XCTDs
915 XBTs k AXBT!!
Fig.ll.7 Shows the sampling pattems during RR97. Three pane1s (top left and right and
bottom left) represent the data collected during the exercise; 5 ships and 17 aircraft flights
acquired 416 CTDs and XCTDs and 975 XBTs and AXBTs during the period 18 August - 4
October 1997. The samp1ing pattems were designed for maximum spatial coverage with
constraints imposed by platform capabi1ities and mission needs. Some pattems were preplanned whi1e others were adaptive1y p1anned as forecasts and conditions dictated. The
hottom right pane1 shows the data positions for the POEM 1986 data which formed the
initial conditions for the RR97 forecasting. + signs indicate the position of XBTs and
AXBTs. The small circles indicate the position of CTDs and XCTDs.