

90 Andrew C. Lorenc
Pr~or probob~L~t,lJ of gross error P(Gl= .05
Poster~or probob~L~t,lJ of gross error P(G!,lJl= .62
.6 r-----------------------------------------------~
.... p[~) = N[~; 10, A)
- - p[x) = N(x; O, 9)
.48
'X" benefl t (C=
O)
benefl t [C=
9)
benefl t [C= 36)
.36
.24
-10
-5
o
5
10
15
x
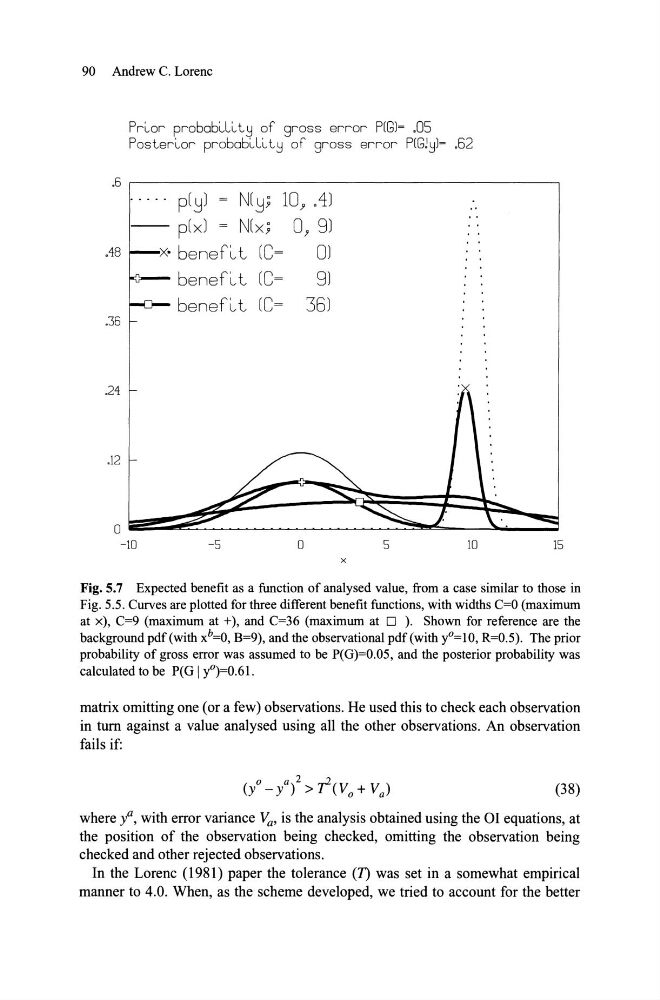
Fig.5.7 Expected benefit as a function of analysed value, from a case similar to those in
Fig. 5.5. Curves are plotted for three different benefit functions, with widths C=O (maximum
at x), C=9 (maximum at +), and C=36 (maximum at O ). Shown for reference are the
background pdf(with xb=O, B=9), and the observational pdf(with yo=lO, R=O.5). The prior
probability of gross error was assumed to be P(G)=0.05, and the posterior probability was
ca1culated to be P(G I ~)=0.61.
matrix omitting one (or a few) observations. He used this to check each observation
in turn against a value analysed using aH the other observations. An observation
fails if:
(38)
where ya, with error variance Va' is the analysis obtained using the OI equations, at
the position of the observation being checked, omitting the observation being
checked and other rejected observations.
In the Lorenc (1981) paper the tolerance (1) was set in a somewhat empirical
manner to 4.0. When, as the scheme developed, we tried to account for the better
Pr~or probob~L~t,lJ of gross error P(Gl= .05
Poster~or probob~L~t,lJ of gross error P(G!,lJl= .62
.6 r-----------------------------------------------~
.... p[~) = N[~; 10, A)
- - p[x) = N(x; O, 9)
.48
'X" benefl t (C=
O)
benefl t [C=
9)
benefl t [C= 36)
.36
.24
-10
-5
o
5
10
15
x
Fig.5.7 Expected benefit as a function of analysed value, from a case similar to those in
Fig. 5.5. Curves are plotted for three different benefit functions, with widths C=O (maximum
at x), C=9 (maximum at +), and C=36 (maximum at O ). Shown for reference are the
background pdf(with xb=O, B=9), and the observational pdf(with yo=lO, R=O.5). The prior
probability of gross error was assumed to be P(G)=0.05, and the posterior probability was
ca1culated to be P(G I ~)=0.61.
matrix omitting one (or a few) observations. He used this to check each observation
in turn against a value analysed using aH the other observations. An observation
fails if:
(38)
where ya, with error variance Va' is the analysis obtained using the OI equations, at
the position of the observation being checked, omitting the observation being
checked and other rejected observations.
In the Lorenc (1981) paper the tolerance (1) was set in a somewhat empirical
manner to 4.0. When, as the scheme developed, we tried to account for the better