

86
Hale and Pflaumann
Dissimilar Samples073 em (elust 1)
30 -
o 13 em (clust 2)
Similar Temperatures
r--.258 cm (elust. 4)
25 -
(core Geob 1312)
-
.303 cm (clust. 6) r--
0
c:
"' 20
'1:1
c:
::I
.s:J
15
, -
<
> 10
~
-
Qj
n
a:: 5
0 1 m. ,ru, I.n-... ,L, Ir ,mI,rn : j . ~, m mtf .rh. , ...&L
:l
= :2 c;, '" '0, 0 :; ~ ro "- iii '"
0
0
>
Q)
IT
:l
'"
~
~
.)
Q)
0
'0
c: 'c c
Q)
.s:J
'iii
c
~
'0
c;, E
.0
.0
'" E
0
ro
2
ro
:l
2
ro
0
u
u
Cl.
2 '"
species
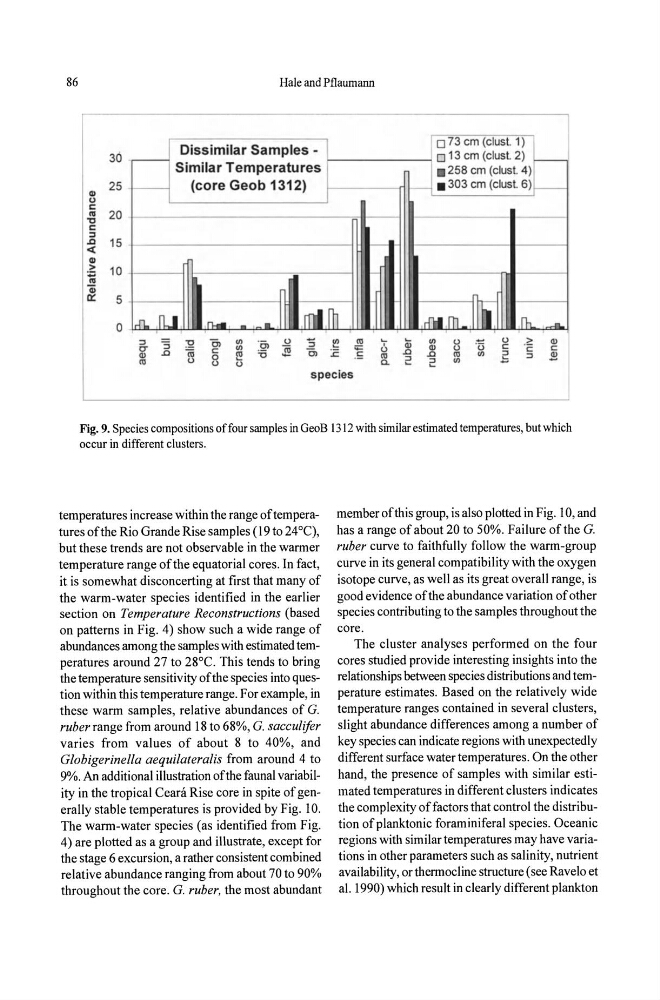
Fig. 9. Species compositions of four samples in GeoB 1312 with similar estimated temperatures, but which
occur in different clusters.
temperatures increase within the range of temperatures of the Rio Grande Rise samples (19 to 24°C),
but these trends are not observable in the warmer
temperature range ofthe equatorial cores. In fact,
it is somewhat disconcerting at first that many of
the warm-water species identified in the earlier
section on Temperature Reconstructions (based
on patterns in Fig. 4) show such a wide range of
abundances among the samples with estimated temperatures around 27 to 28°C. This tends to bring
the temperature sensitivity of the species into question within this temperature range. For example, in
these warm samples, relative abundances of G,
ruber range from around 18 to 68%, G. sacculifer
varies from values of about 8 to 40%, and
Globigerinella aequilateralis from around 4 to
9%. An additional illustration of the faunal variability in the tropical Ceara Rise core in spite of generally stable temperatures is provided by Fig. 10.
The warm-water species (as identified from Fig.
4) are plotted as a group and illustrate, except for
the stage 6 excursion, a rather consistent combined
relative abundance ranging from about 70 to 90%
throughout the core. G, ruber, the most abundant
member of this group, is also plotted in Fig. 10, and
has a range of about 20 to 50%. Failure of the G.
ruber curve to faithfully follow the warm-group
curve in its general compatibility with the oxygen
isotope curve, as well as its great overall range, is
good evidence of the abundance variation of other
species contributing to the samples throughout the
core.
The cluster analyses performed on the four
cores studied provide interesting insights into the
relationships between species distributions and temperature estimates. Based on the relatively wide
temperature ranges contained in several clusters,
slight abundance differences among a number of
key species can indicate regions with unexpectedly
different surface water temperatures. On the other
hand, the presence of samples with similar estimated temperatures in different clusters indicates
the complexity of factors that control the distribution of planktonic foraminiferal species. Oceanic
regions with similar temperatures may have variations in other parameters such as salinity, nutrient
availability, or thermocline structure (see Ravelo et
al. 1990) which result in clearly different plankton
Hale and Pflaumann
Dissimilar Samples073 em (elust 1)
30 -
o 13 em (clust 2)
Similar Temperatures
r--.258 cm (elust. 4)
25 -
(core Geob 1312)
-
.303 cm (clust. 6) r--
0
c:
"' 20
'1:1
c:
::I
.s:J
15
, -
<
> 10
~
-
Qj
n
a:: 5
0 1 m. ,ru, I.n-... ,L, Ir ,mI,rn : j . ~, m mtf .rh. , ...&L
:l
= :2 c;, '" '0, 0 :; ~ ro "- iii '"
0
0
>
Q)
IT
:l
'"
~
~
.)
Q)
0
'0
c: 'c c
Q)
.s:J
'iii
c
~
'0
c;, E
.0
.0
'" E
0
ro
2
ro
:l
2
ro
0
u
u
Cl.
2 '"
species
Fig. 9. Species compositions of four samples in GeoB 1312 with similar estimated temperatures, but which
occur in different clusters.
temperatures increase within the range of temperatures of the Rio Grande Rise samples (19 to 24°C),
but these trends are not observable in the warmer
temperature range ofthe equatorial cores. In fact,
it is somewhat disconcerting at first that many of
the warm-water species identified in the earlier
section on Temperature Reconstructions (based
on patterns in Fig. 4) show such a wide range of
abundances among the samples with estimated temperatures around 27 to 28°C. This tends to bring
the temperature sensitivity of the species into question within this temperature range. For example, in
these warm samples, relative abundances of G,
ruber range from around 18 to 68%, G. sacculifer
varies from values of about 8 to 40%, and
Globigerinella aequilateralis from around 4 to
9%. An additional illustration of the faunal variability in the tropical Ceara Rise core in spite of generally stable temperatures is provided by Fig. 10.
The warm-water species (as identified from Fig.
4) are plotted as a group and illustrate, except for
the stage 6 excursion, a rather consistent combined
relative abundance ranging from about 70 to 90%
throughout the core. G, ruber, the most abundant
member of this group, is also plotted in Fig. 10, and
has a range of about 20 to 50%. Failure of the G.
ruber curve to faithfully follow the warm-group
curve in its general compatibility with the oxygen
isotope curve, as well as its great overall range, is
good evidence of the abundance variation of other
species contributing to the samples throughout the
core.
The cluster analyses performed on the four
cores studied provide interesting insights into the
relationships between species distributions and temperature estimates. Based on the relatively wide
temperature ranges contained in several clusters,
slight abundance differences among a number of
key species can indicate regions with unexpectedly
different surface water temperatures. On the other
hand, the presence of samples with similar estimated temperatures in different clusters indicates
the complexity of factors that control the distribution of planktonic foraminiferal species. Oceanic
regions with similar temperatures may have variations in other parameters such as salinity, nutrient
availability, or thermocline structure (see Ravelo et
al. 1990) which result in clearly different plankton