

84
Hale and Ptlaumann
,
. -
I
I Core GeoB 1312 - Foram
25
assemblage comparison
r--I
Q)
u
20
c:
- -
1\1
-i
83 em (23.8 deg.)
I
"C
c: 15
:::l
0 98 em (21 .5 deg .)
.0
.(
10
Q)
>
:.;::;
l'tI
5
1TI1Jl n,
-~I rn ill
iii
- -
-
a::
r1"1m
rnr
0
.,...,
~
:l
:; :s! c;, VI
VI
'0,
()
:; ~ os "E .... Q; Vl ()
()
>
Q)
0C
VI
:c 'C ~
0;:
u
Q)
()
'0
c
'c c
Q)
.n OJ
c;, :c
os
.n
os
()
0
~
Q)
oS
c
os
2
.n
os
VI
:l
:l
~
()
()
"0
Q)
Co
2
VI
.to
E
species
I
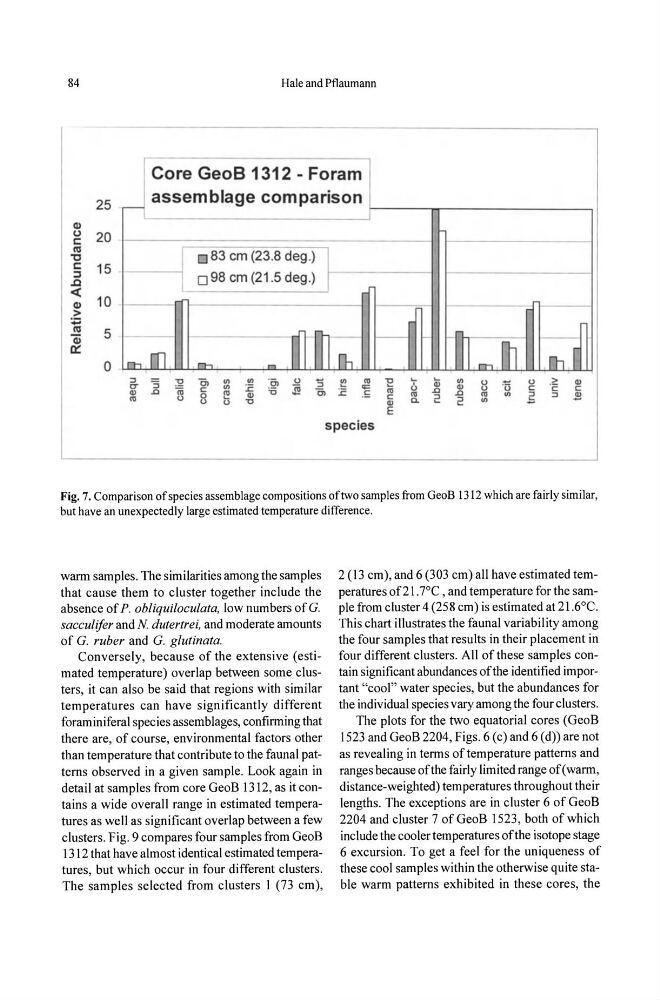
Fig. 7. Comparison of species assemblage compositions of two samples from GeoB I312 which are fairly similar,
but have an unexpectedly large estimated temperature difference.
wann samples. The similarities among the samples
that cause them to cluster together include the
absence of P. obliquiloculata, low numbers ofG.
sacculifer and N dutertrei, and moderate amounts
of G. ruber and G. glutinata.
Conversely, because of the extensive (estimated temperature) overlap between some clusters, it can also be said that regions with similar
temperatures can have significantly different
foraminiferal species assemblages, confirming that
there are, of course, environmental factors other
than temperature that contribute to the faunal patterns observed in a given sample. Look again in
detail at samples from core GeoB 1312, as it contains a wide overall range in estimated temperatures as well as significant overlap between a few
clusters. Fig. 9 compares four samples from GeoB
1312 that have almost identical estimated temperatures, but which occur in four different clusters.
The samples selected from clusters 1 (73 cm),
2 (13 cm), and 6 (303 cm) all have estimated temperatures of21. 7°C, and temperature for the sample from cluster 4 (258 cm) is estimated at 21 .6°C.
This chart illustrates the faunal variability among
the four samples that results in their placement in
four different clusters. All of these samples contain significant abundances of the identified important "cool" water species, but the abundances for
the individual species vary among the four clusters.
The plots for the two equatorial cores (GeoB
1523 and GeoB 2204, Figs. 6 (c) and 6 (d» are not
as revealing in terms of temperature patterns and
ranges because ofthe fairly limited range of(wann,
distance-weighted) temperatures throughout their
lengths. The exceptions are in cluster 6 of GeoB
2204 and cluster 7 of GeoB 1523, both of which
include the cooler temperatures of the isotope stage
6 excursion. To get a feel for the uniqueness of
these cool samples within the otherwise quite stable warm patterns exhibited in these cores, the
Hale and Ptlaumann
,
. -
I
I Core GeoB 1312 - Foram
25
assemblage comparison
r--I
Q)
u
20
c:
- -
1\1
-i
83 em (23.8 deg.)
I
"C
c: 15
:::l
0 98 em (21 .5 deg .)
.0
.(
10
Q)
>
:.;::;
l'tI
5
1TI1Jl n,
-~I rn ill
iii
- -
-
a::
r1"1m
rnr
0
.,...,
~
:l
:; :s! c;, VI
VI
'0,
()
:; ~ os "E .... Q; Vl ()
()
>
Q)
0C
VI
:c 'C ~
0;:
u
Q)
()
'0
c
'c c
Q)
.n OJ
c;, :c
os
.n
os
()
0
~
Q)
oS
c
os
2
.n
os
VI
:l
:l
~
()
()
"0
Q)
Co
2
VI
.to
E
species
I
Fig. 7. Comparison of species assemblage compositions of two samples from GeoB I312 which are fairly similar,
but have an unexpectedly large estimated temperature difference.
wann samples. The similarities among the samples
that cause them to cluster together include the
absence of P. obliquiloculata, low numbers ofG.
sacculifer and N dutertrei, and moderate amounts
of G. ruber and G. glutinata.
Conversely, because of the extensive (estimated temperature) overlap between some clusters, it can also be said that regions with similar
temperatures can have significantly different
foraminiferal species assemblages, confirming that
there are, of course, environmental factors other
than temperature that contribute to the faunal patterns observed in a given sample. Look again in
detail at samples from core GeoB 1312, as it contains a wide overall range in estimated temperatures as well as significant overlap between a few
clusters. Fig. 9 compares four samples from GeoB
1312 that have almost identical estimated temperatures, but which occur in four different clusters.
The samples selected from clusters 1 (73 cm),
2 (13 cm), and 6 (303 cm) all have estimated temperatures of21. 7°C, and temperature for the sample from cluster 4 (258 cm) is estimated at 21 .6°C.
This chart illustrates the faunal variability among
the four samples that results in their placement in
four different clusters. All of these samples contain significant abundances of the identified important "cool" water species, but the abundances for
the individual species vary among the four clusters.
The plots for the two equatorial cores (GeoB
1523 and GeoB 2204, Figs. 6 (c) and 6 (d» are not
as revealing in terms of temperature patterns and
ranges because ofthe fairly limited range of(wann,
distance-weighted) temperatures throughout their
lengths. The exceptions are in cluster 6 of GeoB
2204 and cluster 7 of GeoB 1523, both of which
include the cooler temperatures of the isotope stage
6 excursion. To get a feel for the uniqueness of
these cool samples within the otherwise quite stable warm patterns exhibited in these cores, the