

Sea-Surface Temperature Estimations Using a Modem Analog Technique
83
25
6
cil 23
Q)
:g.
a.
E 21
~
19
29
6
cil 27
Q)
:g.
a.
E 25
~
23
20
[ ] GeoS 1312
9
1
11
+ 1
•
,
I
2 3 4 5 6 7 8
Cluster Number
GeoS 1523
7
20 6
• e
7 ~
"
I
J
,
2 3 4 5 6 7 8
Cluster Number
24
6
cil 22
Q)
:g.
ci.
E 20
~
6
cil Q)
18
29
28
:g. 27
a.
E
~ 26
25
ffi] GeoS 1309
6
I
I
,
2 3 4 5 6 7 8
Cluster Number
GeoS 2204
14
7
Q I
14
14
. ~
"
,
2
3
4 5 6
7
8
Cluster Number
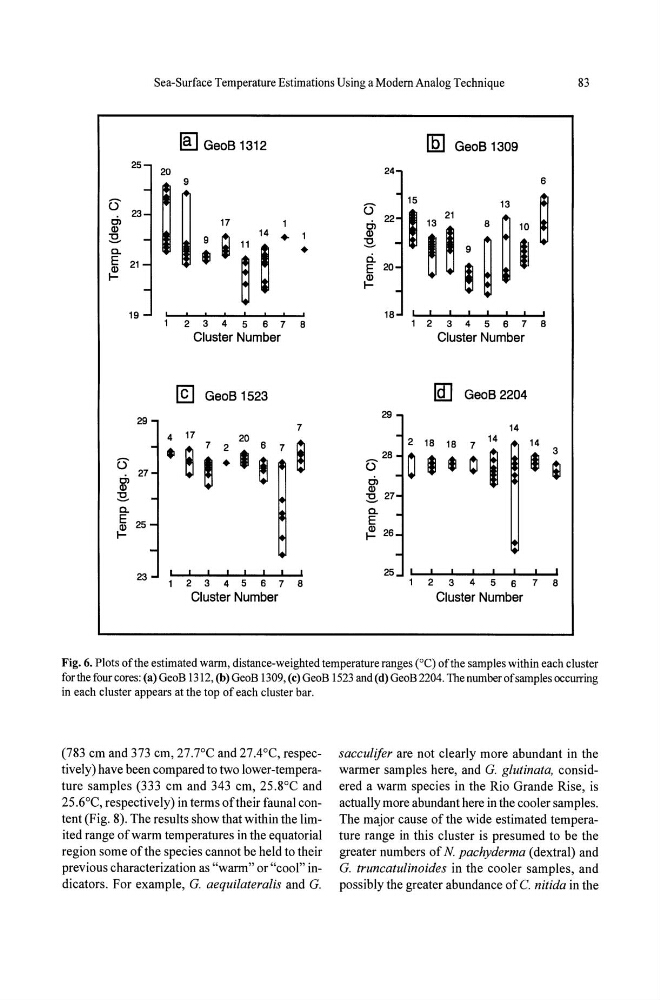
Fig. 6. Plots of the estimated warm, distance-weighted temperature ranges (0C) of the samples within each cluster
for the four cores: (a) GeoB 1312, (b) GeoB 1309, (c) GeoB 1523 and (d) GeoB2204. The number of samples occurring
in each cluster appears at the top of each cluster bar.
(783 cm and 373 cm, 27.7°C and 27.4°C, respectively) have been compared to two lower-temperature samples (333 cm and 343 cm, 2S.8°C and
2S.6°C, respectively) in terms oftheir faunal content (Fig. 8). The results show that within the limited range of warm temperatures in the equatorial
region some of the species cannot be held to their
previous characterization as "warm" or "cool" indicators. For example, G. aequilateralis and G.
sacculifer are not clearly more abundant in the
warmer samples here, and G. glutinata, considered a warm species in the Rio Grande Rise, is
actually more abundant here in the cooler samples.
The major cause of the wide estimated temperature range in this cluster is presumed to be the
greater numbers of N pachyderma (dextral) and
G. truncatulinoides in the cooler samples, and
possibly the greater abundance of C. nitida in the
83
25
6
cil 23
Q)
:g.
a.
E 21
~
19
29
6
cil 27
Q)
:g.
a.
E 25
~
23
20
[ ] GeoS 1312
9
1
11
+ 1
•
,
I
2 3 4 5 6 7 8
Cluster Number
GeoS 1523
7
20 6
• e
7 ~
"
I
J
,
2 3 4 5 6 7 8
Cluster Number
24
6
cil 22
Q)
:g.
ci.
E 20
~
6
cil Q)
18
29
28
:g. 27
a.
E
~ 26
25
ffi] GeoS 1309
6
I
I
,
2 3 4 5 6 7 8
Cluster Number
GeoS 2204
14
7
Q I
14
14
. ~
"
,
2
3
4 5 6
7
8
Cluster Number
Fig. 6. Plots of the estimated warm, distance-weighted temperature ranges (0C) of the samples within each cluster
for the four cores: (a) GeoB 1312, (b) GeoB 1309, (c) GeoB 1523 and (d) GeoB2204. The number of samples occurring
in each cluster appears at the top of each cluster bar.
(783 cm and 373 cm, 27.7°C and 27.4°C, respectively) have been compared to two lower-temperature samples (333 cm and 343 cm, 2S.8°C and
2S.6°C, respectively) in terms oftheir faunal content (Fig. 8). The results show that within the limited range of warm temperatures in the equatorial
region some of the species cannot be held to their
previous characterization as "warm" or "cool" indicators. For example, G. aequilateralis and G.
sacculifer are not clearly more abundant in the
warmer samples here, and G. glutinata, considered a warm species in the Rio Grande Rise, is
actually more abundant here in the cooler samples.
The major cause of the wide estimated temperature range in this cluster is presumed to be the
greater numbers of N pachyderma (dextral) and
G. truncatulinoides in the cooler samples, and
possibly the greater abundance of C. nitida in the