

~
'l
~
8i
~r ..
~Jr
1
~ ~~Tf=~
\
- fJ~t
.. 4iPI ~
~ _"
~ I
"".-:;;:
1'- I' " 1ro
>S>' -!
\or I
I II>
(
:;;
.
#
•
.. 1
No.. ,
q
~~
. .JE
I
, 1 :1\1!~
'q
I
'.
,,/1 . . ',
~
.
ff' -
~
< . .
--~ .
..... .
. • .I>
v . . . . . .
h'/I"
', .
U' .. C'i ~
c·
-
-,
• •
'"
, ~
i
~
•
"'--•
•
•
: " - . ~:
'. 1"l
I ••••••••• •• •••• ••
p
~
•
~
-~
~~m.w_o
I
l'I~
...
~l;:
. ........ 00 .
'1 II
-4"""""..
lI!
:n
~~
~'~ ' .'51
N
~
~~O'G'Iou.w'Ul....
~
Pi
~
UI
!
'
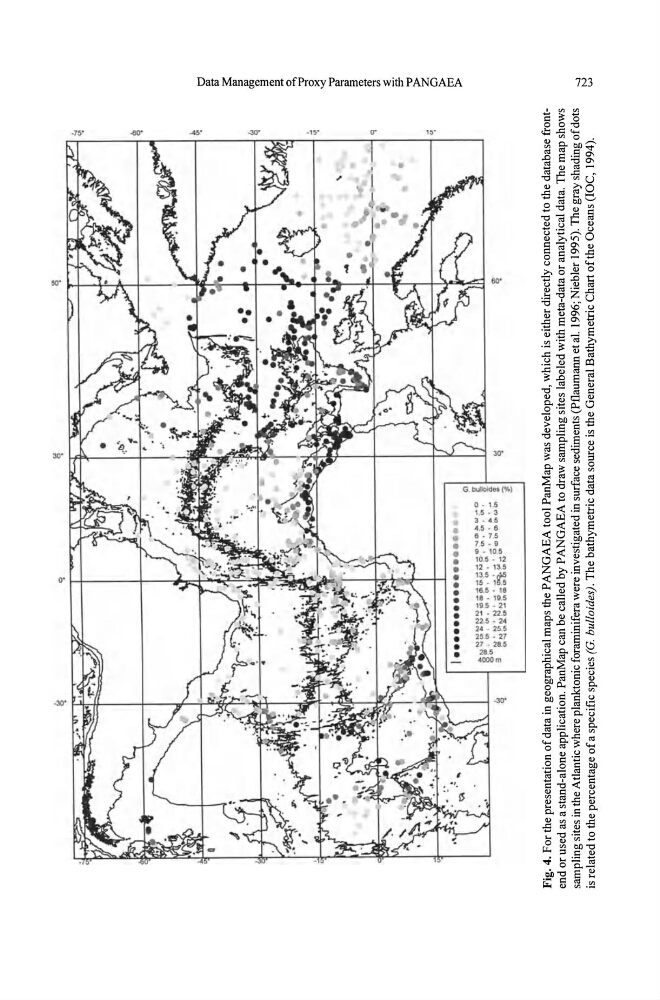
Fig. 4. For the presentation of data in geographical maps the PANGAEA tool PanMap was developed, which is either directly connected to the database frontend or used as a stand-alone application. PanMap can be called by PANGAEA to draw sampling sites labeled with meta-data or analytical data. The map shows
sampling sites in the Atlantic where planktonic foraminifera were investigated in surface sediments (Ptlaumann et al. 1996; Niebler 1995). The gray shading of dots
is related to the percentage
ofa specific species
(G. bulloides) . The bathymetric data source is the General Bathymetric Chart of the Oceans (rOC, 1994).
i
I (1)
:3
a
o
-,
1
~
~
~
s:
~
a
:>
~
-.J
tv
W