

PS1431-1
ORO)
"
.
P51431-1
(S ... dter.)
1000
PS1431-1
(Susc.pt.)
15.50
P514l1-1
(taC03)
ID •
P51431-1
(R>
P5101-1
(CNorh)
PS1431-1
(N.p.chsind180)
505.5
3.:5 0
PS1648-1
(IRD)
,.
.
P51648-1
(hndter.)
1000
P5, .... ,
(Susoept.)
. .,
.
P51648-1
(taCoo)
PS1641-1
PS1841-1
PS1848_1
(Radio)
(Chlorite)
(N.pachsind180)
10
•
eo •
:50:5.5
3.:5
OD
b
II" ')' IW:'
'II
IW' .... ' 1I"Ij;" I " .... ,/i'
II
,'1""/'
I~'
"'Ik*'
'01,' I~
'''II'''t!'I'''','/
1.0
2.0
3.0
4.0
5.0
6.0
7.0
B.O
9.0
Depth (m) max., 9.40
m
(.
+$
+.fi :
:j:
+/
)
+1
}+
t+
+
-If.
+
+
+ +
'-(
lep+++
++
+-+:
t
}~
t
~
+
PerAot example
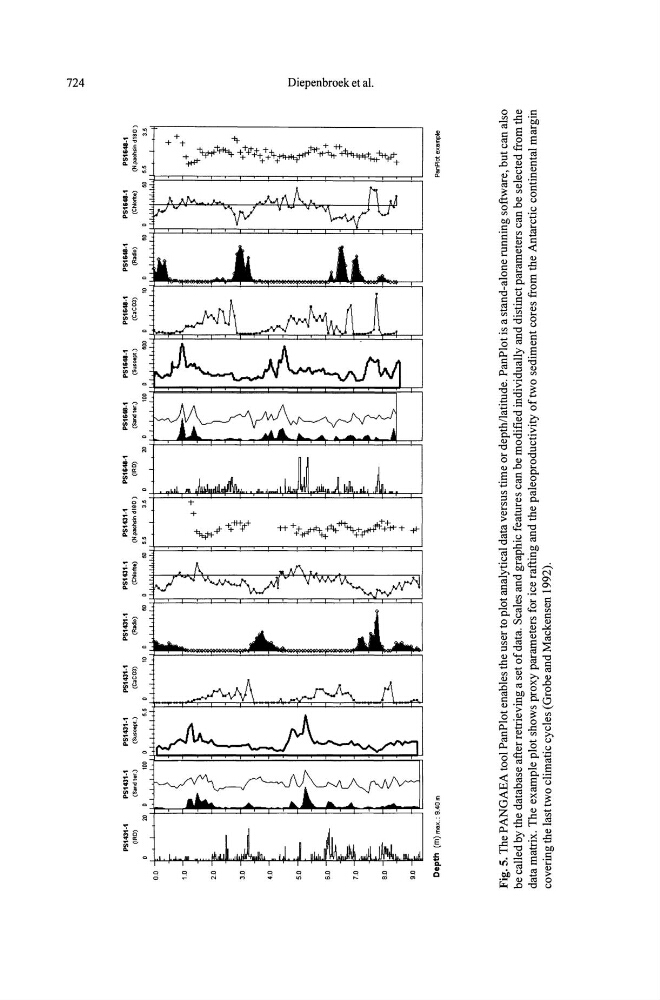
Fig. 5.
The PANGAEA tool PanPlot enables the user to plot analytical data versus time or depth/latitude. PanPlot is a stand-alone running software, but can also
be called by the database after retrieving a set of data, Scales and graphic features can be modified individually and distinct parameters can be selected from the
data matrix. The example plot shows proxy parameters for ice rafting and the paleoproductivity of two sediment cores from the Antarctic continental margin
covering the last
two climatic cycles (Grobe and Mackensen 1992),
~
tl
.go
I
~
~