

722
Diepenbroek et al.
Database center
+
,
+
tsmporary
1
t·~~~
~.=~~
~e%.~
WorldWIde Web
Client
Subserver
Client
Client
Remote sites
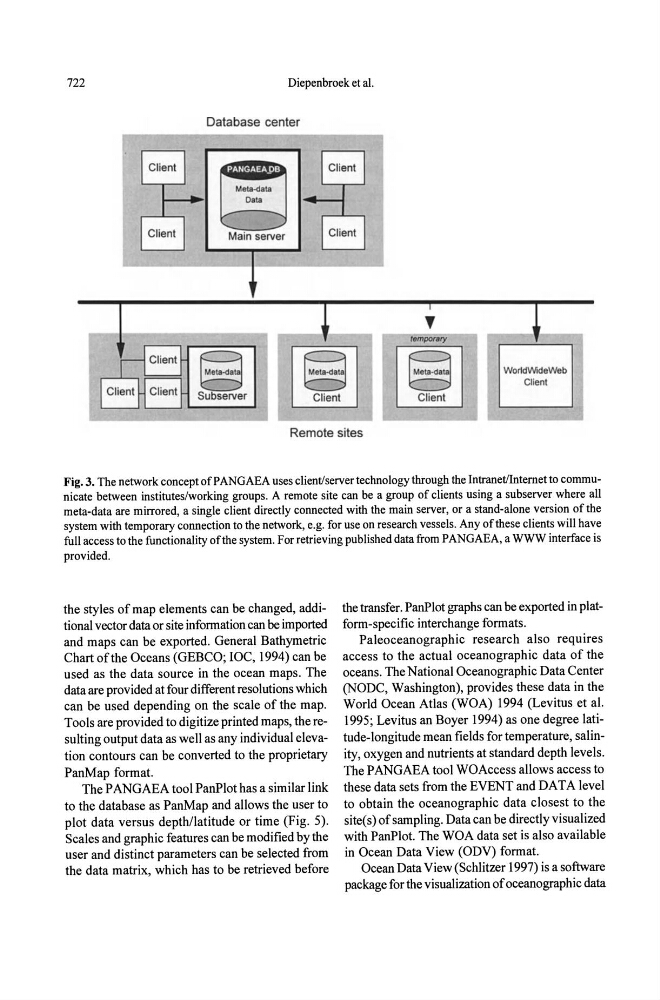
Fig. 3. The network concept of PANGAEA uses client/server technology through the IntranetlIntemet to communicate between institutes/working groups. A remote site can be a group of clients using a sub server where all
meta-data are mirrored, a single client directly connected with the main server, or a stand-alone version of the
system with temporary connection to the network, e.g. for use on research vessels. Any of these clients will have
full access to the functionality of the system. For retrieving published data from PANGAEA, a WWW interface is
provided.
the styles of map elements can be changed, additional vector data or site information can be imported
and maps can be exported. General Bathymetric
Chart of the Oceans (GEBCO; roc, 1994) can be
used as the data source in the ocean maps. The
data are provided at four different resolutions which
can be used depending on the scale of the map.
Tools are provided to digitize printed maps, the resulting output data as well as any individual elevation contours can be converted to the proprietary
PanMap format.
The PANGAEA tool PanPlot has a similar link
to the database as PanMap and allows the user to
plot data versus depthllatitude or time (Fig. 5).
Scales and graphic features can be modified by the
user and distinct parameters can be selected from
the data matrix, which has to be retrieved before
the transfer. PanPlot graphs can be exported in platform-specific interchange formats.
Paleoceanographic research also requires
access to the actual oceanographic data of the
oceans. The National Oceanographic Data Center
(NODC, Washington), provides these data in the
World Ocean Atlas (WOA) 1994 (Levitus et al.
1995; Levitus an Boyer 1994) as one degree latitude-longitude mean fields for temperature, salinity, oxygen and nutrients at standard depth levels.
The PANGAEA tool WOAccess allows access to
these data sets from the EVENT and DATA level
to obtain the oceanographic data closest to the
site(s) of sampling. Data can be directly visualized
with PanPlot. The WOA data set is also available
in Ocean Data View (ODV) fonnat.
Ocean Data V jew (Schlitzer 1997) is a software
package for the visualization of oceanographic data