

702
Herterich et al.
(1987), Heinze et al. (1991), Heinze and
Hasselmann (1993). This model neglects the seasonal variation in the carbon cycle. The physical
input consists of annual mean values of velocity,
temperature, salinity and convective adjustment
rates. The fields used here result from an ocean
model based on the Hamburg LSG (cf. section
Ocean modelling) and were calculated by Paul
and Seidov (1997).
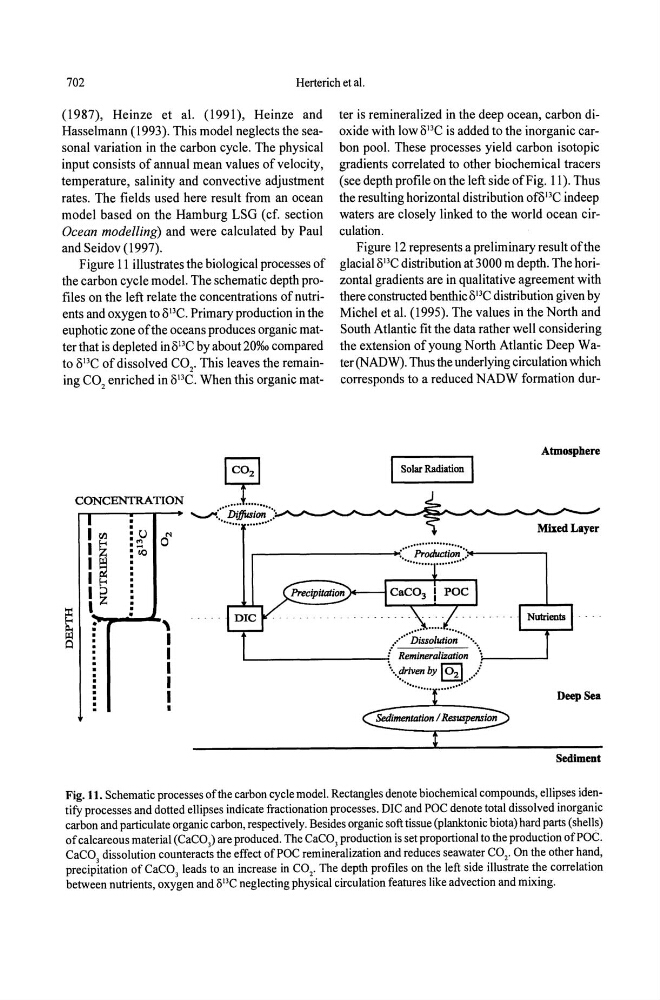
Figure 11 illustrates the biological processes of
the carbon cycle model. The schematic depth profiles on the left relate the concentrations of nutrients and oxygen to OIlC. Primary production in the
euphotic zone ofthe oceans produces organic matter that is depleted in 013C by about 20%0 compared
to OIlC of dissolved CO 2 , This leaves the remaining CO 2 enriched in OIlC. When this organic mat~
ter is remineralized in the deep ocean, carbon dioxide with low OIlC is added to the inorganic carbon pool. These processes yield carbon isotopic
gradients correlated to other biochemical tracers
(see depth profile on the left side of Fig. 11). Thus
the resulting horizontal distribution ofol3C indeep
waters are closely linked to the world ocean circulation.
Figure 12 represents a preliminary result ofthe
glacialo ll C distribution at 3000 m depth. The horizontal gradients are in qualitative agreement with
there constructed benthic OIlC distribution given by
Michel et al. (1995). The values in the North and
South Atlantic fit the data rather well considering
the extension of young North Atlantic Deep Water (NADW). Thus the underlying circulation which
corresponds to a reduced NADW formation durAtmosphere
Solar Radiation
CONCENTRATION
.. X . . . . .
- : .... I?!.~~~? ... ).. . . --""-----....,--.~--...... -----,.,.--- Mixed Layer
L~ u N
I f-<
'" 0
I ~
to
I f-<
I ~
,
/ .• ····'jj~s~;~tion····· ..•••.
'------------i' Remineralization ';-' - - - - - - '
....... rfriven by [§] .. /
~i::'~
·
,
· ·
I
· ·
I
· ·
I
· ·
I
·
·
·
I
·
·
•
DeepSea
Sediment
Fig. 11. Schematic processes ofthe carbon cycle model. Rectangles denote biochemical compounds, ellipses identify processes and dotted ellipses indicate fractionation processes. DIC and POC denote total dissolved inorganic
carbon and particulate organic carbon, respectively. Besides organic soft tissue (planktonic biota) hard parts (shells)
of calcareous material (CaCO,) are produced. The CaCO, production is set proportional to the production ofPOC.
CaCO, dissolution counteracts the effect ofPOC remineralization and reduces seawater CO 2 , On the other hand,
precipitation of CaCO, leads to an increase in CO 2 , The depth profiles on the left side illustrate the correlation
between nutrients, oxygen and 013C neglecting physical circulation features like advection and mixing.