

664
Paul etal.
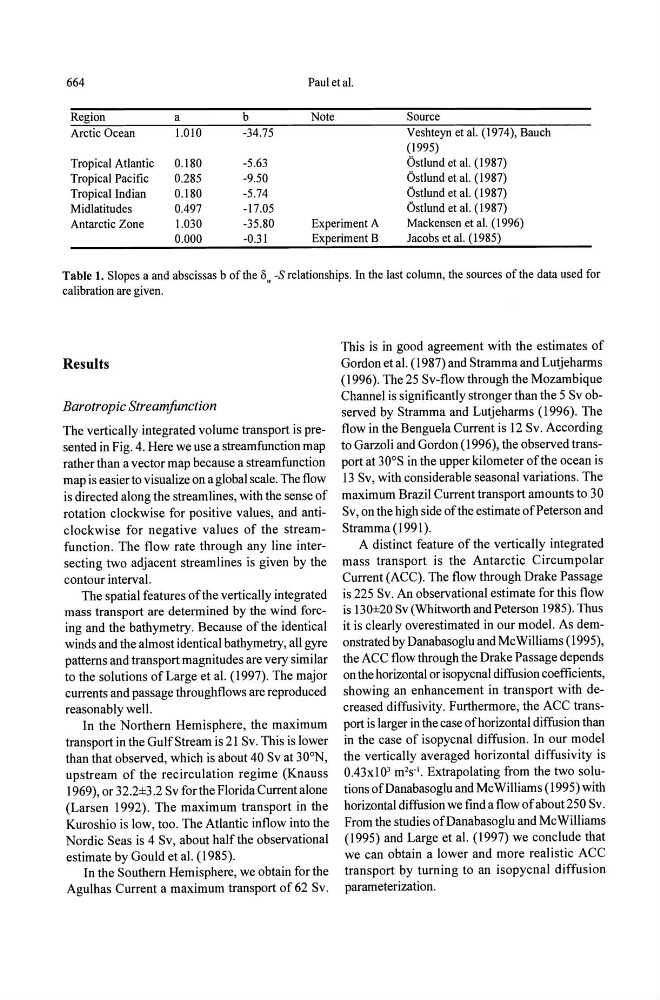
Region
a
Arctic Ocean
1.010
Tropical Atlantic
0.180
Tropical Pacific
0.285
Tropical Indian
0.180
Midlatitudes
0.497
b
-34.75
-5.63
-9.50
-5.74
-17.05
Note
Source
Veshteyn et al. (1974), Bauch
(1995)
Antarctic Zone
1.030
0.000
-35.80
-0.31
Experiment A
Experiment B
Ostlund et al. (I 987)
Ostlund et al. (1987)
Ostlund et al. (1987)
Ostlund et al. (I987)
Mackensen et al. (I 996)
Jacobs et al. (I985)
Table 1. Slopes a and abscissas b ofthe 8. -Srelationships. In the last column, the sources of the data used for
calibration are given.
Results
Barotropic Stream/unction
The vertically integrated volume transport is presented in Fig. 4. Here we use a stream function map
rather than a vector map because a streamfunction
map is easier to visualize on a global scale. The flow
is directed along the streamlines, with the sense of
rotation clockwise for positive values, and anticlockwise for negative values of the streamfunction. The flow rate through any line intersecting two adjacent streamlines is given by the
contour interval.
The spatial features ofthe vertically integrated
mass transport are determined by the wind forcing and the bathymetry. Because of the identical
winds and the almost identical bathymetry, all gyre
patterns and transport magnitudes are very similar
to the solutions of Large et al. (1997). The major
currents and passage through flows are reproduced
reasonably well.
In the Northern Hemisphere, the maximum
transport in the Gulf Stream is 21 Sv. This is lower
than that observed, which is about 40 Sv at 30 0 N,
upstream of the recirculation regime (Knauss
1969), or 32.2±3.2 Sv for the Florida Current alone
(Larsen 1992). The maximum transport in the
Kuroshio is low, too. The Atlantic inflow into the
Nordic Seas is 4 Sv, about half the observational
estimate by Gould et al. (1985).
In the Southern Hemisphere, we obtain for the
Agulhas Current a maximum transport of62 Sv.
This is in good agreement with the estimates of
Gordon et al. (1987) and Stramma and Lutjeharrns
(\996). The 25 Sv-flow through the Mozambique
Channel is significantly stronger than the 5 Svobserved by Stramma and Lutjeharrns (1996). The
flow in the Benguela Current is 12 Sv. According
to Garzoli and Gordon (1996), the observed transport at 30 0 S in the upper kilometer of the ocean is
13 Sv, with considerable seasonal variations. The
maximum Brazil Current transport amounts to 30
Sv, on the high side ofthe estimate of Peterson and
Stramma (1991 ).
A distinct feature of the vertically integrated
mass transport is the Antarctic Circumpolar
Current (ACC). The flow through Drake Passage
is 225 Sv. An observational estimate for this flow
is 130±20 Sv (Whitworth and Peterson 1985). Thus
it is clearly overestimated in our model. As demonstrated by Danabasoglu and McWilliams (1995),
the ACC flow through the Drake Passage depends
on the horizontal or isopycnal diffusion coefficients,
showing an enhancement in transport with decreased diffusivity. Furthermore, the ACC transport is larger in the case of horizontal diffusion than
in the case of isopycnal diffusion. In our model
the vertically averaged horizontal diffusivity is
0.43xl0 J m 2 s· l • Extrapolating from the two solutions ofDanabasoglu and McWilliams (1995) with
horizontal diffusion we find a flow of about 250 Sv.
From the studies ofDanabasoglu and McWilliams
(1995) and Large et al. (1997) we conclude that
we can obtain a lower and more realistic ACC
transport by turning to an isopycnal diffusion
parameterization.