

Simulation of Oxygen Isotopes in a Global Ocean Model
663
.~
! 1.5
~
;
1
m
",0 0 . 5
-...,
Tropical Atlantic
~ • •
y = 0.180·x - 5.63
O+---r-~~-'--~---r--'---~--+
34
34.5
35
35.5
36
36.5
37
37.5
38
salinity (permil)
Tropical Indian
1.5+-....:...-'---'---'--.L....-'--'-.....J'--_+
•
~
y = 0.180x . 5.74
.0.5+--..--..--..--r--r--r--.---+
33
33.5
34
34.5
35
35.5
36
36.5
37
salinity (permil)
Arctic Ocean
'E 0
..
8.
~·1
~
; ·2
oJ
m ·3
o
'" ..
r"
y = 1.010x -34.75
·5+---r---r--'--~---r--'---"---+
28
29
30
31
32
33
34
35
36
salinity (permil)
Global Ocean
...
. . ~
, "
' .
. .11,
.. ,.
I
,
.4+---.-~'-.----r--..--~--+
28
30
32
34
36
38
40
salinity (permil)
Tropical Pacific
1.5+--'-..1---'---'-_-'-_'-_'-_'--+
~
:
o . '
, 0
•
•
f •
y= 0.285x ·9.50
·0.5 +--..--..--r--r---,.----,--.-_+
33.5
34
34.5
35
35.5
36
36.5
37
37.5
salinity (permil)
Midlatitudes
1.5,---'---'----.L....---'----'----r
I
Q; 0.5
j
oJ
0
CIl
en
aJO-O.5
-...,
o
y = 0.497x - 17.05
.1-'--,----~----~----_r----_r~
33
34
35
36
37
salinity (permil)
Antarctic Zone
.0.1 +-_-'-_-'-_.L...._.L...._'--~'__.....J'--_+
. ~
CIl ·0.2
•
o
S
~
; ·0.3
m
en
!DO ·OAr"
·0.5 +---'-"""T'"-..,-~' ""T""-""-~-""T""-+
34
_1 _2 _3 MA M. M. _7 M~
salinity (permil)
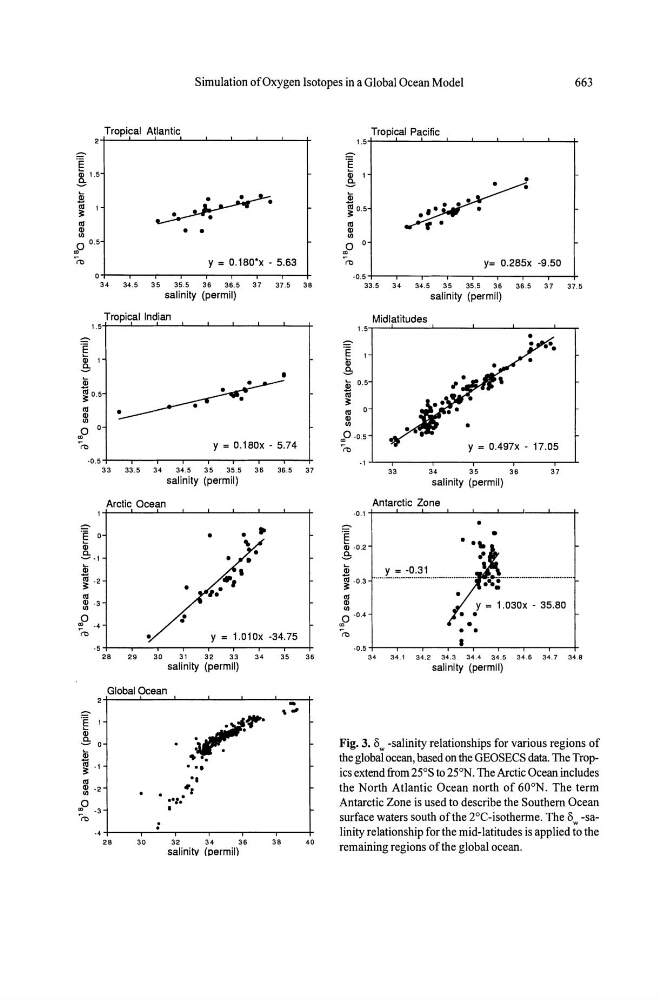
Fig. 3. /)w -salinity relationships for various regions of
the global ocean, based on the GEOSECS data. The Tropics extend from 25°S to 25°N. The Arctic Ocean includes
the North Atlantic Ocean north of 60 0 N. The term
Antarctic Zone is used to describe the Southern Ocean
surface waters south of the 2°C-isotherme. The /)w -salinity relationship for the mid-latitudes is applied to the
remaining regions of the global ocean.