

Simulation of Oxygen Isotopes in a Global Ocean Model
661
horizontally isotropic grid boxes) and is finally kept
constant at 1.8° poleward of 60° (to prevent any
further restrictions on the model time step).
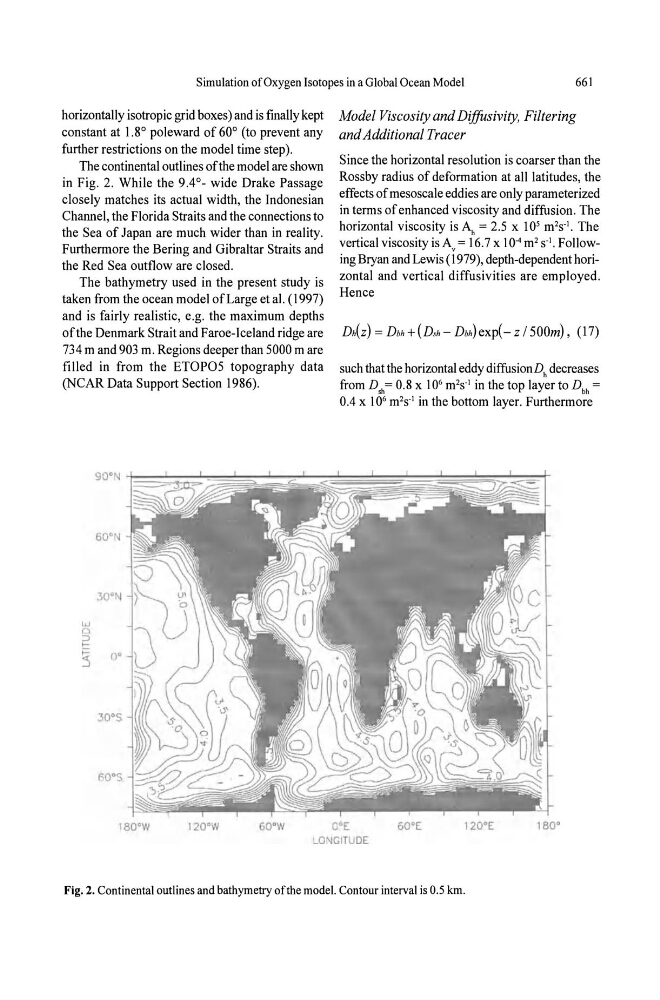
The continental outlines ofthe model are shown
in Fig. 2. While the 9.4°_ wide Drake Passage
closely matches its actual width, the Indonesian
Channel, the Florida Straits and the connections to
the Sea of Japan are much wider than in reality.
Furthermore the Bering and Gibraltar Straits and
the Red Sea outflow are closed.
The bathymetry used in the present study is
taken from the ocean model of Large et al. (1997)
and is fairly realistic, e.g. the maximum depths
ofthe Denmark Strait and Faroe-Iceland ridge are
734 m and 903 m. Regions deeper than 5000 mare
filled in from the ETOP05 topography data
(NCAR Data Support Section 1986).
30 0 N
iLl
a
:::)
t3 o·
30·5
Model Viscosity and DijJusivity, Filtering
andAdditional Tracer
Since the horizontal resolution is coarser than the
Rossby radius of deformation at all latitudes, the
effects of mesoscale eddies are only parameterized
in terms of enhanced viscosity and diffusion. The
horizontal viscosity is Ah = 2.5 X 10 5 m 2 s·'. The
vertical viscosity isAv = 16.7 x 10⁻⁴ m 2 s·'. Following Bryan and Lewis (1979), depth-dependent horizontal and vertical diffusivities are employed.
Hence
Dh(Z) = Dbh + (D,h - Dbh)exp( - Z / 500m), (17)
such that the horizontal eddy diffusionD h decreases
from D sh = 0.8 x 10 6 m 2 s" in the top layer to Dbh =
0.4 x 10 6 m 2 s" in the bottom layer. Furthermore
l 80'VI
120°\,/
60'\'/
O'E
LONGITUDE
60 0 E
120'E
180·
Fig. 2. Continental outlines and bathymetry of the model. Contour interval is 0.5 km.