

650
Bleil and von Dobeneck
E
~
.s::::
a. .,
c
E
.9
-0
.&:J
.6
::::l
en
Magnetic
Field Model
20
40
60
80
100
120
140
160
180
200
-1 0
1
Lock-in Function
at Reversals and
Partial PDRM
Total
PDRM
0.5
1 -1 0 1
:t!:.'" co
"0
a.
Terrigenous Sediment
Relative
PaleoIntensity
o
20
40
60
80
100
120
140
160
180
200
Lock-in Function
at Reversals and
Partial PDRM
0.5
Total
PDRM
-1 0 1
Carbonate Sediment
Relative
PaleoIntensity
o
1
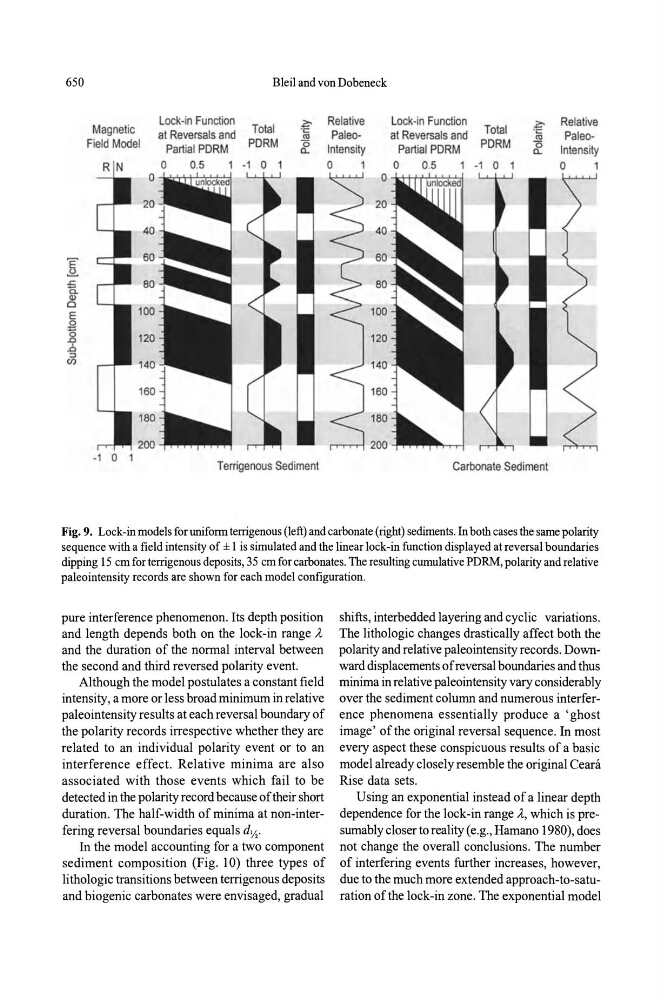
Fig.9. Lock-in models for uniform terrigenous (left) and carbonate (right) sediments. In both cases the same polarity
sequence with a field intensity of ± I i s simulated and the linear lock-in function displayed at reversal boundaries
dipping 15 em for terrigenous deposits, 35 em for carbonates. The resulting cumulative PDRM, polarity and relative
paleointensity records are shown for each model configuration.
pure interference phenomenon. Its depth position
and length depends both on the lock-in range A.
and the duration of the normal interval between
the second and third reversed polarity event.
Although the model postulates a constant field
intensity, a more or less broad minimum in relative
paleointensity results at each reversal boundary of
the polarity records irrespective whether they are
related to an individual polarity event or to an
interference effect. Relative minima are also
associated with those events which fail to be
detected in the polarity record because of their short
duration. The half-width of minima at non-interfering reversal boundaries equals d'/,.
In the model accounting for a two component
sediment composition (Fig. 10) three types of
lithologic transitions between terrigenous deposits
and biogenic carbonates were envisaged, gradual
shifts, interbedded layering and cyclic variations.
The lithologic changes drastically affect both the
polarity and relative paleointensity records. Downward displacements of reversal boundaries and thus
minima in relative paleointensity vary considerably
over the sediment column and numerous interference phenomena essentially produce a ' ghost
image' of the original reversal sequence. In most
every aspect these conspicuous results of a basic
model already closely resemble the original Ceara
Rise data sets.
Using an exponential instead of a linear depth
dependence for the lock-in range A., which is presumably closer to reality (e.g., Hamano 1980), does
not change the overall conclusions. The number
of interfering events further increases, however,
due to the much more extended approach-to-saturation of the lock-in zone. The exponential model