

612
von Dobeneck and Schmieder
pass filtering), the horizontal shift of the central
maximum of the cross-covariance function
(Fig. 9b, d) corresponds to the requested lag
(Fig. 9c). According to this analysis, the susceptibility record of core GeoB 1523-1 lags precessional
forcing by 1.77 kyr and leads 8 18 0 by 3.90 kyr
which adds up to a plausible total delay of 5 .67 kyr
between PI and 8 18 0.
Starting out from the 8 18 0 based correlation
age (Fig. lOa), precession tuning is a straightforward, but typically iterative procedure (Fig. lOb).
Each step starts with filtering the time series in an
}}l>, l>,
'
ONID
'
0
8 8 :0
0
www 0
~
~
;
:0
o
}}
..... '
!!! !!!
D..D..
}
<»
!!!
D..
:?~lltlt':: I I &til !+J20
HlliJl_:o
..... en
: "
, ,
6 , i ; , -10 b
~~]VN~~y:l
H~~oj
~ W t t t ! ; !
i!
" i
rSO.!!l
H ii i i ' i :
w
"
~
a 0.01 0.02 0.03 0.04 0.05 0.06
Frequency [1/kyr]
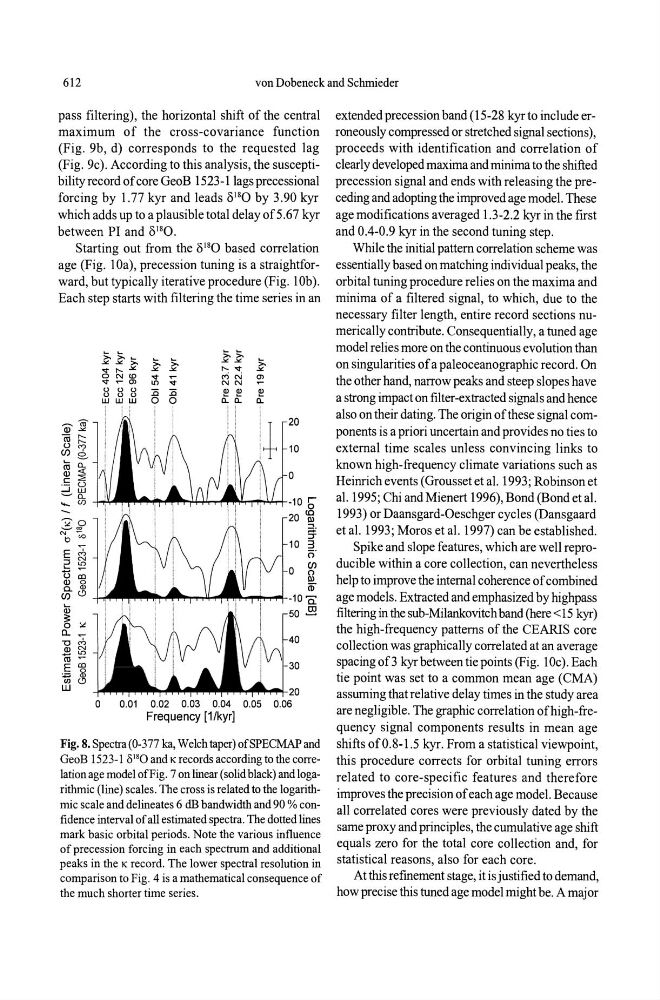
Fig. 8. Spectra (0-377 ka, Welch taper) of SPECMAP and
GeoB 1523-1 1) 18 0 and Krecords according to the correlation age model of Fig. 7 on linear (solid black) and logarithmic (line) scales. The cross is related to the logarithmic scale and delineates 6 dB bandwidth and 90 % confidence interval of all estimated spectra. The dotted lines
mark basic orbital periods. Note the various influence
of precession forcing in each spectrum and additional
peaks in the K record. The lower spectral resolution in
comparison to Fig. 4 is a mathematical consequence of
the much shorter time series.
extended precession band (15-28 kyr to include erroneously compressed or stretched signal sections),
proceeds with identification and correlation of
clearly developed maxima and minima to the shifted
precession signal and ends with releasing the preceding and adopting the improved age model. These
age modifications averaged 1.3-2.2 kyr in the first
and 0.4-0.9 kyr in the second tuning step.
While the initial pattern correlation scheme was
essentially based on matching individual peaks, the
orbital tuning procedure relies on the maxima and
minima of a filtered signal, to which, due to the
necessary filter length, entire record sections numerically contribute. Consequentially, a tuned age
model relies more on the continuous evolution than
on singularities of a paleoceanographic record. On
the other hand, narrow peaks and steep slopes have
a strong impact on filter-extracted signals and hence
also on their dating. The origin ofthese signal components is a priori uncertain and provides no ties to
external time scales unless convincing links to
known high-frequency climate variations such as
Heinrich events (Grousset et al. 1993; Robinson et
al. 1995; Chi and Mienert 1996), Bond (Bond et al.
1993) or Daansgard-Oeschger cycles (Dansgaard
et al. 1993; Moros et al. 1997) can be established.
Spike and slope features, which are well reproducible within a core collection, can nevertheless
help to improve the internal coherence of combined
age models. Extracted and emphasized by highpass
filtering in the sub-Milankovitch band (here <15 kyr)
the high-frequency patterns of the CEARIS core
collection was graphically correlated at an average
spacing of3 kyrbetween tie points (Fig. 10c). Each
tie point was set to a common mean age (CMA)
assuming that relative delay times in the study area
are negligible. The graphic correlation ofhigh-frequency signal components results in mean age
shifts of 0.8-1.5 kyr. From a statistical viewpoint,
this procedure corrects for orbital tuning errors
related to core-specific features and therefore
improves the precision of each age model. Because
all correlated cores were previously dated by the
same proxy and principles, the cumulative age shift
equals zero for the total core collection and, for
statistical reasons, also for each core.
At this refinement stage, it is justified to demand,
how precise this tuned age model might be. A major