

Using Rock Magnetic Proxy Records for Orbital Tuning and Extended Time Series Analyses
609
the logarithmic spectra gradually sharpened at both
refmements of the age model. To benefit from this
precessional signal component, a target curve of
normalized obliquity and precession index (mixing
ratio of2:3 chosen by visual evaluation) and 4.5 kyr
lag was calculated, comprising not just more, but
also more prominent signal features than either single orbital parameter. The obliquity-tuned primary
susceptibility record was filtered using a wide
bandpass (15-47 kyr) to include obliquity and precession cycles. As many extrema as possible were
matched (Fig. 3d), admittedly at the resolution limit
of these records. The resulting fmal age models are
again just slight modifications of the previous models and possibly not even more precise in absolute
ages as the precession time lag is undetermined.
Nevertheless, this higher-frequency tuning leads to
a better mutual signal correlation of the SUSAS
records and therefore to an improved conservation
of signal details in the SUSAS stack (Fig. 5). Because of the very different amplitude ranges, the
stack was determined as an arithmetic mean of
normalized (subtraction of core mean and division
by standard deviation), interpolated (M=2 kyr)
records.
Bioturbation should be responsible for the comparatively low spectral power in the precession
band. Its effect can be assessed from the fact that
sections of higher sedimentation rate (e.g. interval
0.6-0.2 Ma) clearly coincide better with precession
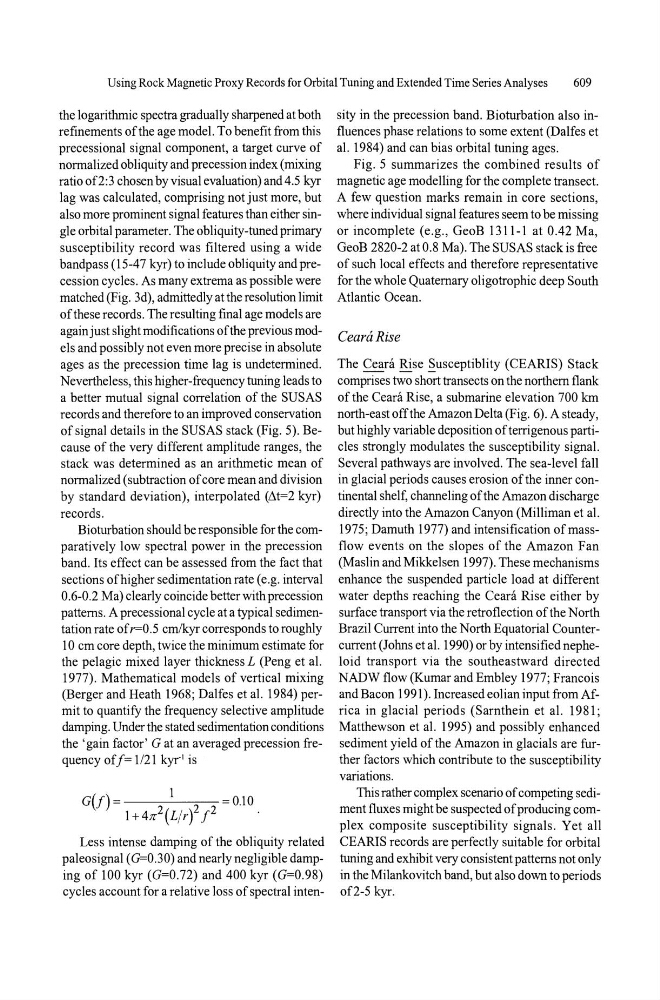
patterns. A precessional cycle at a typical sedimentation rate of r=0.5 cm/kyr corresponds to roughly
10 cm core depth, twice the minimum estimate for
the pelagic mixed layer thickness L (Peng et al.
1977). Mathematical models of vertical mixing
(Berger and Heath 1968; Dalfes et al. 1984) permit to quantify the frequency selective amplitude
damping. Under the stated sedimentation conditions
the 'gain factor' G at an averaged precession frequency of/= 1121 kyrl is
G(!) =
1 2
0.10
1 + 41l.2(L/r) /2
Less intense damping of the obliquity related
paleosignal (G=OJO) and nearly negligible damping of 100 kyr (G=O.72) and 400 kyr (G=0.98)
cycles account for a relative loss of spectral intensity in the precession band. Bioturbation also influences phase relations to some extent (Dalfes et
al. 1984) and can bias orbital tuning ages.
Fig. 5 summarizes the combined results of
magnetic age modelling for the complete transect.
A few question marks remain in core sections,
where individual signal features seem to be missing
or incomplete (e.g., GeoB 1311-1 at 0.42 Ma,
GeoB 2820-2 at 0.8 Ma). The SUSAS stack is free
of such local effects and therefore representative
for the whole Quaternary oligotrophic deep South
Atlantic Ocean.
Ceara Rise
The Ceara Rise §.usceptiblity (CEARIS) Stack
comprises two short transects on the northem flank
of the Ceara Rise, a submarine elevation 700 km
north-east off the Amazon Delta (Fig. 6). A steady,
but highly variable deposition ofterrigenous particles strongly modulates the susceptibility signal.
Several pathways are involved. The sea-level fall
in glacial periods causes erosion of the inner continental shelf, channeling of the Amazon discharge
directly into the Amazon Canyon (Milliman et al.
1975; Damuth 1977) and intensification of massflow events on the slopes of the Amazon Fan
(Maslin and Mikkelsen 1997). These mechanisms
enhance the suspended particle load at different
water depths reaching the Ceara Rise either by
surface transport via the retroflection of the North
Brazil Current into the North Equatorial Countercurrent (Johns et al. 1990) or by intensified nepheloid transport via the southeastward directed
NADW flow (Kumar and Embley 1977; Francois
and Bacon 1991). Increased eolian inputfrom Africa in glacial periods (Samthein et al. 1981;
Matthewson et al. 1995) and possibly enhanced
sediment yield ofthe Amazon in glacials are further factors which contribute to the susceptibility
variations.
This rather complex scenario of competing sediment fluxes might be suspected of producing complex composite susceptibility signals. Yet all
CEARIS records are perfectly suitable for orbital
tuning and exhibit very consistent patterns not only
in the Milankovitch band, but also down to periods
of2-5 kyr.