

536
Dupont
o ~~w.e~~==~~~~
10
20
~ -H~----~r-tft----~~~~~~-----.~-------=~~----~
40
50
ro -H~------~~flr--~~ __ --H-----------~----------~*-----~
70
80
00
100
110
120
1~ ~~------f---tff----~~---t~~~----~~r-------~~~------~~~
140
150
ka
o 20 40 60 60 % 0 20 40 00 80 %0 20 40 60 80 % 0 20 40 60 80 % 0 20 40 60 80 %
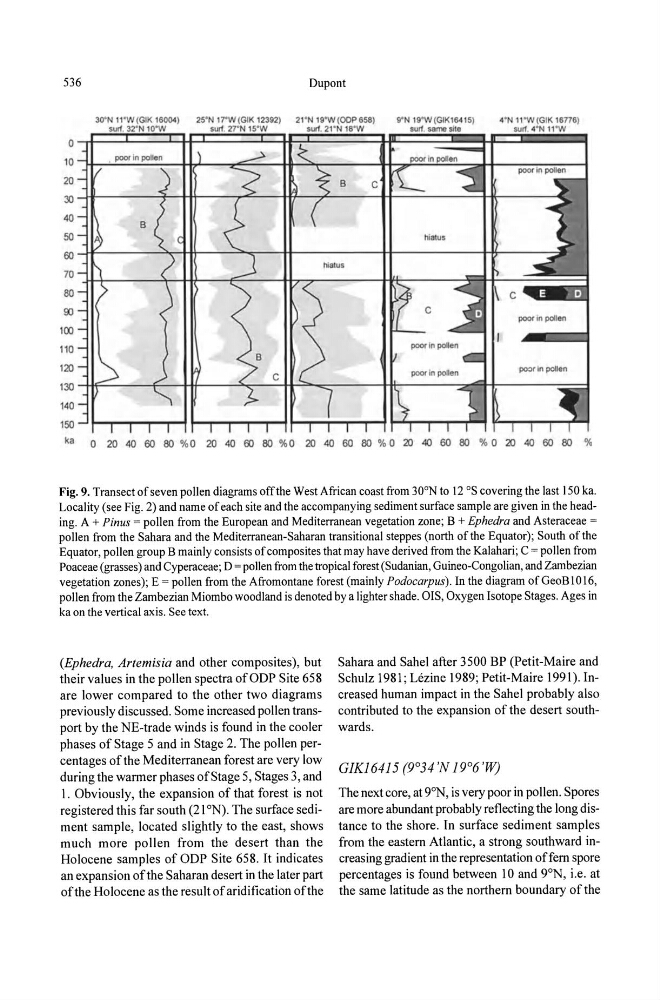
Fig. 9. Transect of seven pollen diagrams off the West African coast from 30 a N to 12 aS covering the last 150 ka.
Locality (see Fig. 2) and name of each site and the accompanying sediment surface sample are given in the heading. A + Pinus = pollen from the European and Mediterranean vegetation zone; B + Ephedra and Asteraceae =
pollen from the Sahara and the Mediterranean-Saharan transitional steppes (north of the Equator); South of the
Equator, pollen group B mainly consists of composites that may have derived from the Kalahari; C = pollen from
Poaceae (grasses) and Cyperaceae; D = pollen from the tropical forest (Sudanian, Guineo-Congolian, and Zam bezian
vegetation zones); E = pollen from the Afromontane forest (mainly Podocarpus). In the diagram of GeoB I 016,
pollen from the Zambezian Miombo woodland is denoted by a lighter shade. OIS, Oxygen Isotope Stages. Ages in
ka on the vertical axis. See text.
(Ephedra, Artemisia and other composites), but
their values in the pollen spectra ofODP Site 658
are lower compared to the other two diagrams
previously discussed. Some increased pollen transport by the NE-trade winds is found in the cooler
phases of Stage 5 and in Stage 2. The pollen percentages of the Mediterranean forest are very low
during the warmer phases of Stage 5, Stages 3, and
I. Obviously, the expansion of that forest is not
registered this far south (21 O N). The surface sediment sample, located slightly to the east, shows
much more pollen from the desert than the
Holocene samples of ODP Site 658. It indicates
an expansion of the Saharan desert in the later part
of the Holocene as the result of aridification of the
Sahara and Sahel after 3500 BP (Petit-Maire and
Schulz 1981 ; Lezine 1989; Petit-Maire 1991). Increased human impact in the Sahel probably also
contributed to the expansion of the desert southwards.
The next core, at 9°N, is very poor in pollen. Spores
are more abundant probably reflecting the long distance to the shore . In surface sediment samples
from the eastern Atlantic, a strong southward increasing gradient in the representation of fern spore
percentages is found between 10 and 9°N, i.e. at
the same latitude as the northern boundary of the
Dupont
o ~~w.e~~==~~~~
10
20
~ -H~----~r-tft----~~~~~~-----.~-------=~~----~
40
50
ro -H~------~~flr--~~ __ --H-----------~----------~*-----~
70
80
00
100
110
120
1~ ~~------f---tff----~~---t~~~----~~r-------~~~------~~~
140
150
ka
o 20 40 60 60 % 0 20 40 00 80 %0 20 40 60 80 % 0 20 40 60 80 % 0 20 40 60 80 %
Fig. 9. Transect of seven pollen diagrams off the West African coast from 30 a N to 12 aS covering the last 150 ka.
Locality (see Fig. 2) and name of each site and the accompanying sediment surface sample are given in the heading. A + Pinus = pollen from the European and Mediterranean vegetation zone; B + Ephedra and Asteraceae =
pollen from the Sahara and the Mediterranean-Saharan transitional steppes (north of the Equator); South of the
Equator, pollen group B mainly consists of composites that may have derived from the Kalahari; C = pollen from
Poaceae (grasses) and Cyperaceae; D = pollen from the tropical forest (Sudanian, Guineo-Congolian, and Zam bezian
vegetation zones); E = pollen from the Afromontane forest (mainly Podocarpus). In the diagram of GeoB I 016,
pollen from the Zambezian Miombo woodland is denoted by a lighter shade. OIS, Oxygen Isotope Stages. Ages in
ka on the vertical axis. See text.
(Ephedra, Artemisia and other composites), but
their values in the pollen spectra ofODP Site 658
are lower compared to the other two diagrams
previously discussed. Some increased pollen transport by the NE-trade winds is found in the cooler
phases of Stage 5 and in Stage 2. The pollen percentages of the Mediterranean forest are very low
during the warmer phases of Stage 5, Stages 3, and
I. Obviously, the expansion of that forest is not
registered this far south (21 O N). The surface sediment sample, located slightly to the east, shows
much more pollen from the desert than the
Holocene samples of ODP Site 658. It indicates
an expansion of the Saharan desert in the later part
of the Holocene as the result of aridification of the
Sahara and Sahel after 3500 BP (Petit-Maire and
Schulz 1981 ; Lezine 1989; Petit-Maire 1991). Increased human impact in the Sahel probably also
contributed to the expansion of the desert southwards.
The next core, at 9°N, is very poor in pollen. Spores
are more abundant probably reflecting the long distance to the shore . In surface sediment samples
from the eastern Atlantic, a strong southward increasing gradient in the representation of fern spore
percentages is found between 10 and 9°N, i.e. at
the same latitude as the northern boundary of the