

Reassessing Foraminiferal Stable Isotope Geochemistry
503
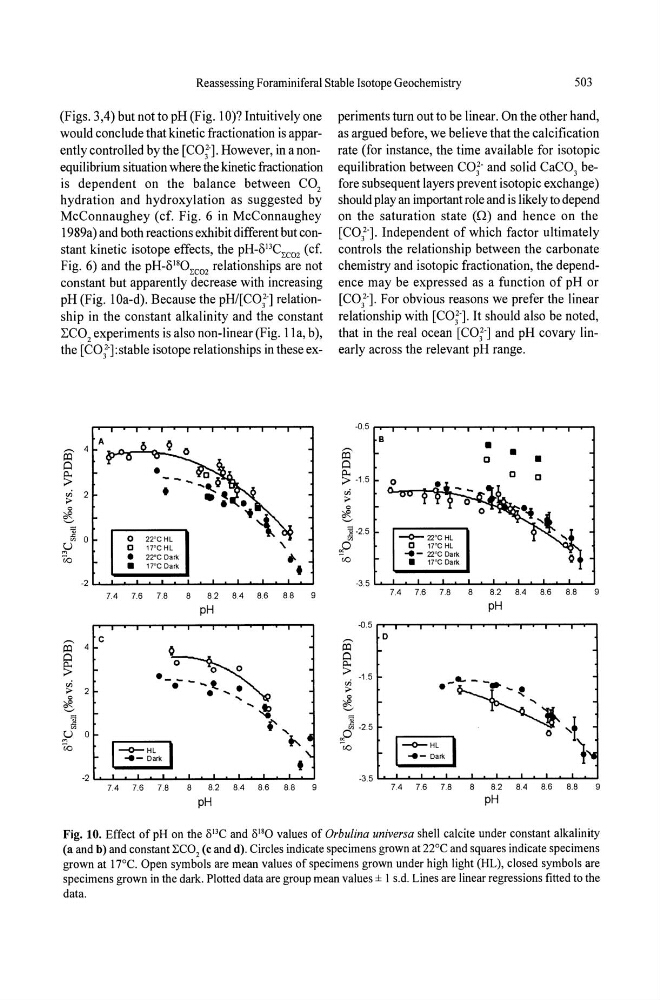
(Figs. 3,4) but not to pH (Fig. 10)? Intuitively one
would conclude that kinetic fractionation is apparently controlled by the [CO;} However, in a nonequilibrium situation where the kinetic fractionation
is dependent on the balance between CO 2
hydration and hydroxylation as suggested by
McConnaughey (cf. Fig. 6 in McConnaughey
1989a) and both reactions exhibit different but constant kinetic isotope effects, the pH-013C~co2 (cf.
Fig. 6) and the pH-ol80 Ico2 relationships are not
constant but apparently decrease with increasing
pH (Fig. lOa-d). Because the pH/[COn relationship in the constant alkalinity and the constant
LC0 2 experiments is also non-linear (Fig. lla, b),
the [COt]:stable isotope relationships in these exiii'
~ 0
Ci
~
•
vi
;;.
2
•
0
~
~ 0
0
22'C HL
!;;J
0
1TCHL
,
r:o
•
22°C Dark
•
•
1TCDark.
•
-2
7.4
7.6
7.8
8.2
8.4
8.6
8.8
pH
c
ii3:' 4
~
vi
;;. 2
0
~
.... ~
~
.-,
!;;J 0
r:o
I-o-HL
+--e- Dark
•
-2
7.4
7.6
7.8
8.2
8.4
8.6
8.8
pH
periments turn out to be linear. On the other hand,
as argued before, we believe that the calcification
rate (for instance, the time available for isotopic
equilibration between CO;- and solid CaC0 3 before subsequent layers prevent isotopic exchange)
should play an important role and is likely to depend
on the saturation state (n) and hence on the
[COn. Independent of which factor ultimately
controls the relationship between the carbonate
chemistry and isotopic fractionation, the dependence may be expressed as a function of pH or
[COn. For obvious reasons we prefer the linear
relationship with [CO;} It should also be noted,
that in the real ocean [COn and pH covary linearly across the relevant pH range.
-0.5
B
iii'
• •
Ci
a
•
~ -1.5
0
0
a
vi
;;.
0
~
] -2.5
- 0 - 22'CHL
~o
0
17°CHL
-e- 22"CDark
00
•
1T'C Dark
-3.5
7.4
7.6
7.8
8.2
8.4
8.6
8.8
pH
-0.5
iii'
0
Ci
~ -1.5
vi
_L __
;;.
.~
0
~
]
oc
O -2.5
o 'f
00
I-o-HL I
)
... - Dark
~~
-3.5
74
7.6
7.8
8.2
8.4
8.6
8.8
pH
Fig. 10. Effect of pH on the 8 J3 C and 8 18 0 values of Orbulina universa shell calcite under constant alkalinity
(a and b) and constant ~C02 (c and d). Circles indicate specimens grown at 22°C and squares indicate specimens
grown at 17°C. Open symbols are mean values of specimens grown under high light (HL), closed symbols are
specimens grown in the dark. Plotted data are group mean values ± 1 s.d. Lines are linear regressions fitted to the
data.
503
(Figs. 3,4) but not to pH (Fig. 10)? Intuitively one
would conclude that kinetic fractionation is apparently controlled by the [CO;} However, in a nonequilibrium situation where the kinetic fractionation
is dependent on the balance between CO 2
hydration and hydroxylation as suggested by
McConnaughey (cf. Fig. 6 in McConnaughey
1989a) and both reactions exhibit different but constant kinetic isotope effects, the pH-013C~co2 (cf.
Fig. 6) and the pH-ol80 Ico2 relationships are not
constant but apparently decrease with increasing
pH (Fig. lOa-d). Because the pH/[COn relationship in the constant alkalinity and the constant
LC0 2 experiments is also non-linear (Fig. lla, b),
the [COt]:stable isotope relationships in these exiii'
~ 0
Ci
~
•
vi
;;.
2
•
0
~
~ 0
0
22'C HL
!;;J
0
1TCHL
,
r:o
•
22°C Dark
•
•
1TCDark.
•
-2
7.4
7.6
7.8
8.2
8.4
8.6
8.8
pH
c
ii3:' 4
~
vi
;;. 2
0
~
.... ~
~
.-,
!;;J 0
r:o
I-o-HL
+--e- Dark
•
-2
7.4
7.6
7.8
8.2
8.4
8.6
8.8
pH
periments turn out to be linear. On the other hand,
as argued before, we believe that the calcification
rate (for instance, the time available for isotopic
equilibration between CO;- and solid CaC0 3 before subsequent layers prevent isotopic exchange)
should play an important role and is likely to depend
on the saturation state (n) and hence on the
[COn. Independent of which factor ultimately
controls the relationship between the carbonate
chemistry and isotopic fractionation, the dependence may be expressed as a function of pH or
[COn. For obvious reasons we prefer the linear
relationship with [CO;} It should also be noted,
that in the real ocean [COn and pH covary linearly across the relevant pH range.
-0.5
B
iii'
• •
Ci
a
•
~ -1.5
0
0
a
vi
;;.
0
~
] -2.5
- 0 - 22'CHL
~o
0
17°CHL
-e- 22"CDark
00
•
1T'C Dark
-3.5
7.4
7.6
7.8
8.2
8.4
8.6
8.8
pH
-0.5
iii'
0
Ci
~ -1.5
vi
_L __
;;.
.~
0
~
]
oc
O -2.5
o 'f
00
I-o-HL I
)
... - Dark
~~
-3.5
74
7.6
7.8
8.2
8.4
8.6
8.8
pH
Fig. 10. Effect of pH on the 8 J3 C and 8 18 0 values of Orbulina universa shell calcite under constant alkalinity
(a and b) and constant ~C02 (c and d). Circles indicate specimens grown at 22°C and squares indicate specimens
grown at 17°C. Open symbols are mean values of specimens grown under high light (HL), closed symbols are
specimens grown in the dark. Plotted data are group mean values ± 1 s.d. Lines are linear regressions fitted to the
data.