

Reassessing Foraminiferal Stable Isotope Geochemistry
499
ate chemistry as the "pulse" solution, fed as usual
and left to calcify the adult chamber and undergo
gametogenesis. It can be calculated that the small
amount of the "pulse" solution that is enclosed by
the membrane and inevitably transferred to the
chase culture medium does not affect the she1l8 13 C
even if all of this "enclosed" carbon is used for
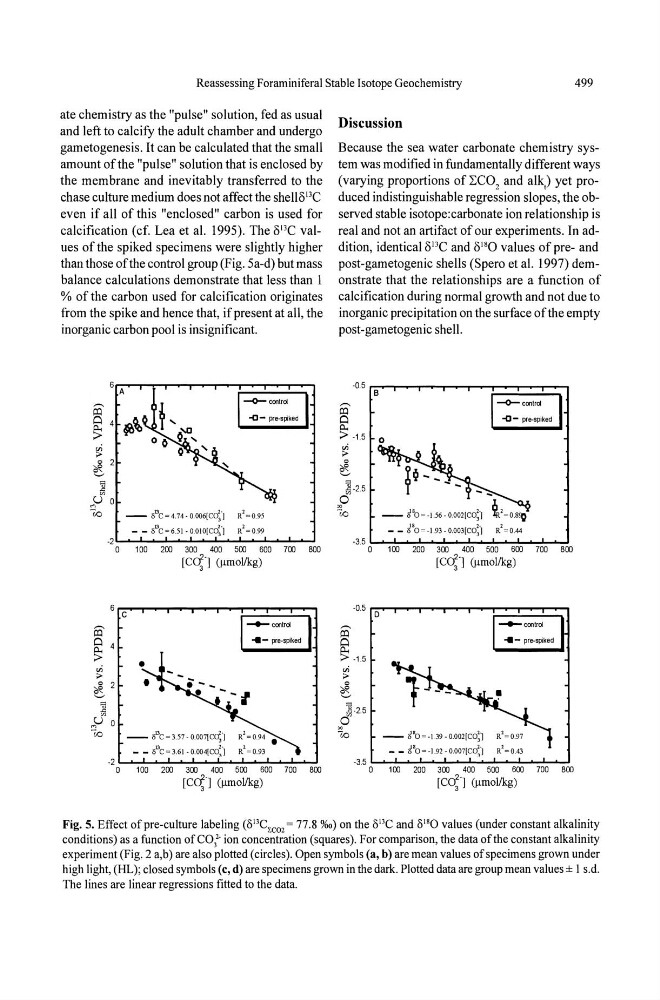
calcification (cf. Lea et al. 1995). The 8 13 C values of the spiked specimens were slightly higher
than those of the control group (Fig. 5a-d) but mass
balance calculations demonstrate that less than 1
% of the carbon used for calcification originates
from the spike and hence that, if present at all, the
inorganic carbon pool is insignificant.
6 A
-o-cootrol
-0- pre-spked
-
a"C~4.74.0.()()6Iro;·]
- - a"C~6.51. o.oIOlro;·]
.2"'0 ...... 1 ... 00 ......... 200'-'-30 ... 0 ......... 40 .... 0 ........ 5 ... 00 ......... 600 ....... -700'--' ....... 600
[cef] (lJ.Illollkg)
c
-
afJc~3.57.0.()()1\ro;·]
__ a"c ~ 3.61· 0.004Iro;·]
_ _ cootrol
.. - pre·s~k.d
·2~~ ...... ~~L-~~-L __ -'-~~~
o 100 200 300 400 500 600 700 800
[c(t] (lJ.Illollkg)
Discussion
Because the sea water carbonate chemistry system was modified in fundamentally different ways
(varying proportions of LC0 2 and alk,) yet produced indistinguishable regression slopes, the observed stable isotope:carbonate ion relationship is
real and not an artifact of our experiments. In addition, identical8 13 C and 8180 values of pre- and
post-gametogenic shells (Spero et al. 1997) demonstrate that the relationships are a function of
calcification during normal growth and not due to
inorganic precipitation on the surface of the empty
post-gametogenic shell.
·0.5
~
~ ·1.5
"
~
~.25
",0
-00
·3.5
·0.5
$'
Q
~ ·1.5
"
~
~.25
0
;200
·3.5
B
0
D
0
-o-control
~- pre-spiked
J'
,.
1.,
-
0 0~.1.56.0.002ICO,] ' IR ~o.~
__ ~BO"".1.93-0.003[CO~·]
R 2 =O.44
100 200 300 400 500 600 700 800
[cq'] (j.Lmollkg)
_ _ control
.. - pre-spiked
_
5HO=-1.39-0.002[CO~1
RL=O.97
__ 5'0 ~ ·1.92· O.OO7[CO:·] R' ~ 0.43
100 200 300 400 500 600 700 800
[cq'] (!!mollkg)
Fig. 5. Effect of pre-culture labeling (/i n C OC02 = 77.8 %0) on the /inc and /i t8 0 values (under constant alkalinity
conditions) as a function of CO,'" ion concentration (squares). For comparison, the data of the constant alkalinity
experiment (Fig. 2 a,b) are also plotted (circles). Open symbols (a, b) are mean values of specimens grown under
high light, (HL); closed symbols (c, d) are specimens grown in the dark. Plotted data are group mean values ± I S.d.
The lines are linear regressions fitted to the data.
499
ate chemistry as the "pulse" solution, fed as usual
and left to calcify the adult chamber and undergo
gametogenesis. It can be calculated that the small
amount of the "pulse" solution that is enclosed by
the membrane and inevitably transferred to the
chase culture medium does not affect the she1l8 13 C
even if all of this "enclosed" carbon is used for
calcification (cf. Lea et al. 1995). The 8 13 C values of the spiked specimens were slightly higher
than those of the control group (Fig. 5a-d) but mass
balance calculations demonstrate that less than 1
% of the carbon used for calcification originates
from the spike and hence that, if present at all, the
inorganic carbon pool is insignificant.
6 A
-o-cootrol
-0- pre-spked
-
a"C~4.74.0.()()6Iro;·]
- - a"C~6.51. o.oIOlro;·]
.2"'0 ...... 1 ... 00 ......... 200'-'-30 ... 0 ......... 40 .... 0 ........ 5 ... 00 ......... 600 ....... -700'--' ....... 600
[cef] (lJ.Illollkg)
c
-
afJc~3.57.0.()()1\ro;·]
__ a"c ~ 3.61· 0.004Iro;·]
_ _ cootrol
.. - pre·s~k.d
·2~~ ...... ~~L-~~-L __ -'-~~~
o 100 200 300 400 500 600 700 800
[c(t] (lJ.Illollkg)
Discussion
Because the sea water carbonate chemistry system was modified in fundamentally different ways
(varying proportions of LC0 2 and alk,) yet produced indistinguishable regression slopes, the observed stable isotope:carbonate ion relationship is
real and not an artifact of our experiments. In addition, identical8 13 C and 8180 values of pre- and
post-gametogenic shells (Spero et al. 1997) demonstrate that the relationships are a function of
calcification during normal growth and not due to
inorganic precipitation on the surface of the empty
post-gametogenic shell.
·0.5
~
~ ·1.5
"
~
~.25
",0
-00
·3.5
·0.5
$'
Q
~ ·1.5
"
~
~.25
0
;200
·3.5
B
0
D
0
-o-control
~- pre-spiked
J'
,.
1.,
-
0 0~.1.56.0.002ICO,] ' IR ~o.~
__ ~BO"".1.93-0.003[CO~·]
R 2 =O.44
100 200 300 400 500 600 700 800
[cq'] (j.Lmollkg)
_ _ control
.. - pre-spiked
_
5HO=-1.39-0.002[CO~1
RL=O.97
__ 5'0 ~ ·1.92· O.OO7[CO:·] R' ~ 0.43
100 200 300 400 500 600 700 800
[cq'] (!!mollkg)
Fig. 5. Effect of pre-culture labeling (/i n C OC02 = 77.8 %0) on the /inc and /i t8 0 values (under constant alkalinity
conditions) as a function of CO,'" ion concentration (squares). For comparison, the data of the constant alkalinity
experiment (Fig. 2 a,b) are also plotted (circles). Open symbols (a, b) are mean values of specimens grown under
high light, (HL); closed symbols (c, d) are specimens grown in the dark. Plotted data are group mean values ± I S.d.
The lines are linear regressions fitted to the data.