

498
Bijmaetal.
experiments and pooled them according to their
discrete positions in the shell whorl for stable isotope measurement(Fig. 4a, b). Regression analyses on data from the 11th, 12th and 13th
chamber groups yield similar o13C/[CO;-J and
0180/[COn slopes demonstrating that ontogenetic
effects have little or no affect on this relationship.
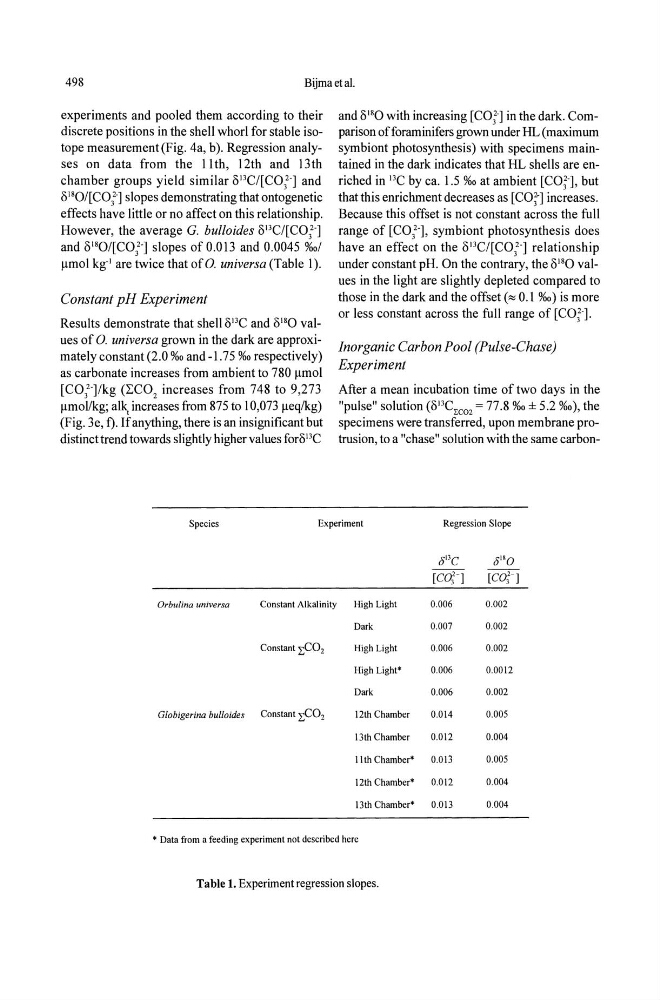
However, the average G. bulloides o13C/[CO;-J
and 0180/[CO;-J slopes of 0.013 and 0.0045 %01
~mol kg· 1 are twice that of 0. universa (Table I).
Constant pH Experiment
Results demonstrate that shell 013C and 0 18 0 values of 0. universa grown in the dark are approximately constant (2.0 %0 and -1. 75 %0 respectively)
as carbonate increases from ambient to 780 ~mol
[C0 3
2 ·]/kg (~C02 increases from 748 to 9,273
~mol/kg; al~ increases from 875 to 1 0,073 ~eq/kg)
(Fig. 3e, t). If anything, there is an insignificant but
distinct trend towards slightly higher values foro 13 C
and 0 18 0 with increasing [CO;] in the dark. Comparison of foraminifers grown under HL (maximum
symbiont photosynthesis) with specimens maintained in the dark indicates that HL shells are enriched in 13C by ca. 1.5 %0 at ambient [COn, but
that this enrichment decreases as [CO:·] increases.
Because this offset is not constant across the full
range of [COn, symbiont photosynthesis does
have an effect on the o13C/[CO;·] relationship
under constant pH. On the contrary, the 0 18 0 values in the light are slightly depleted compared to
those in the dark and the offset ("" 0.1 %0) is more
or less constant across the full range of [CO;"].
Inorganic Carbon Pool (Pulse-Chase)
Experiment
After a mean incubation time of two days in the
"pulse" solution (013C EC02 = 77.8 %0 ± 5.2 %0), the
specimens were transferred, upon membrane protrusion, to a "chase" solution with the same carbonSpecies
Experiment
Regression Slope
8 1J C
8 1 '0
[co;-]
[CO;-]
Orbulina universa
Constant Alkalinity
High Light
0.006
0.002
Dark
0.007
0.002
Constant LC02
High Light
0.006
0.002
High Light'
0.006
0.0012
Dark
0.006
0.002
Globigerina bulloides
Constant LC02
12th Chamber
0.014
0.005
13th Chamber
0.012
0.004
11 th Chamber'
0.013
0.005
12th Chamber"
0.012
0.004
13th Chamber'
0.013
0.004
, Data from a feeding experiment not described here
Table 1. Experiment regression slopes.
Bijmaetal.
experiments and pooled them according to their
discrete positions in the shell whorl for stable isotope measurement(Fig. 4a, b). Regression analyses on data from the 11th, 12th and 13th
chamber groups yield similar o13C/[CO;-J and
0180/[COn slopes demonstrating that ontogenetic
effects have little or no affect on this relationship.
However, the average G. bulloides o13C/[CO;-J
and 0180/[CO;-J slopes of 0.013 and 0.0045 %01
~mol kg· 1 are twice that of 0. universa (Table I).
Constant pH Experiment
Results demonstrate that shell 013C and 0 18 0 values of 0. universa grown in the dark are approximately constant (2.0 %0 and -1. 75 %0 respectively)
as carbonate increases from ambient to 780 ~mol
[C0 3
2 ·]/kg (~C02 increases from 748 to 9,273
~mol/kg; al~ increases from 875 to 1 0,073 ~eq/kg)
(Fig. 3e, t). If anything, there is an insignificant but
distinct trend towards slightly higher values foro 13 C
and 0 18 0 with increasing [CO;] in the dark. Comparison of foraminifers grown under HL (maximum
symbiont photosynthesis) with specimens maintained in the dark indicates that HL shells are enriched in 13C by ca. 1.5 %0 at ambient [COn, but
that this enrichment decreases as [CO:·] increases.
Because this offset is not constant across the full
range of [COn, symbiont photosynthesis does
have an effect on the o13C/[CO;·] relationship
under constant pH. On the contrary, the 0 18 0 values in the light are slightly depleted compared to
those in the dark and the offset ("" 0.1 %0) is more
or less constant across the full range of [CO;"].
Inorganic Carbon Pool (Pulse-Chase)
Experiment
After a mean incubation time of two days in the
"pulse" solution (013C EC02 = 77.8 %0 ± 5.2 %0), the
specimens were transferred, upon membrane protrusion, to a "chase" solution with the same carbonSpecies
Experiment
Regression Slope
8 1J C
8 1 '0
[co;-]
[CO;-]
Orbulina universa
Constant Alkalinity
High Light
0.006
0.002
Dark
0.007
0.002
Constant LC02
High Light
0.006
0.002
High Light'
0.006
0.0012
Dark
0.006
0.002
Globigerina bulloides
Constant LC02
12th Chamber
0.014
0.005
13th Chamber
0.012
0.004
11 th Chamber'
0.013
0.005
12th Chamber"
0.012
0.004
13th Chamber'
0.013
0.004
, Data from a feeding experiment not described here
Table 1. Experiment regression slopes.