

480
Andersen et al.
til
o
"-26
-24
l-22
-20
GeoB 1016-3
t;
1.11
t;
5.2
Ealkenone = 4.2 %0
i(
, 9.
+ alkenone producers
to. f>'
<) bulk
-18 +-~---,--,--,--,---,--,--,--,-----,
40
80
120
160
200
age [ka[
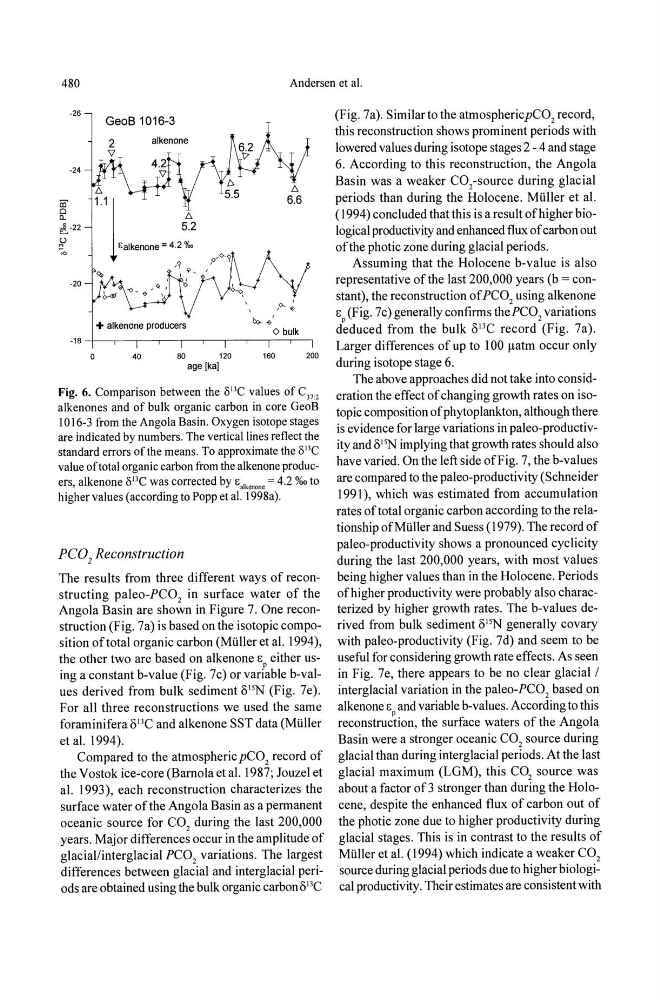
Fig. 6. Comparison between the .s 1J C values of C 37 • 2
alkenones and of bulk organic carbon in core GeoB
1016-3 from the Angola Basin. Oxygen isotope stages
are indicated by numbers. The vertical lines reflect the
standard errors of the means. To approximate the .s 1J C
value of total organic carbon from the alkenone producers, alkenone .s 1J C was corrected by E,,,,,,", = 4.2 %0 to
higher values (according to Popp et al. 1998a).
peG 2 Reconstruction
The results from three different ways of reconstructing paleo-PC0 2 in surface water of the
Angola Basin are shown in Figure 7. One reconstruction (Fig. 7a) is based on the isotopic composition oftotal organic carbon (MUller et al. 1994),
the other two are based on alkenone E either usp
ing a constant b-value (Fig. 7c) or variable b-values derived from bulk sediment ol5N (Fig. 7e).
For all three reconstructions we used the same
foraminifera Ol3C and alkenone SST data (MUller
et al. 1994).
Compared to the atmospheric pC0 2 record of
the Vostok ice-core (Barnola et al. 1987; louzel et
al. 1993), each reconstruction characterizes the
surface water ofthe Angola Basin as a permanent
oceanic source for CO 2 during the last 200,000
years. Major differences occur in the amplitude of
glacial/interglacial PC0 2 variations. The largest
differences between glacial and interglacial periods are obtained using the bulk organic carbono 13 C
(Fig. 7a). Similarto the atmosphericpC0 2 record,
this reconstruction shows prominent periods with
lowered values during isotope stages 2 - 4 and stage
6. According to this reconstruction, the Angola
Basin was a weaker CO 2 -source during glacial
periods than during the Holocene. MUller et al.
(1994) concluded that this is a result of higher biological productivity and enhanced flux of carbon out
ofthe photic zone during glacial periods.
Assuming that the Holocene b-value is also
representative of the last 200,000 years (b = constant), the reconstruction of PC0 2 using alkenone
Ep (Fig. 7c) generally confirms thePC0 2 variations
deduced from the bulk olJC record (Fig. 7a).
Larger differences of up to I 00 ~atm occur only
during isotope stage 6.
The above approaches did not take into consideration the effect of changing growth rates on isotopic composition of phytoplankton, although there
is evidence for large variations in paleo-productivity and ol5N implying that growth rates should also
have varied. On the left side of Fig. 7, the b-values
are compared to the paleo-productivity (Schneider
1991), which was estimated from accumulation
rates of total organic carbon according to the relationship of MUller and Suess (1979). The record of
paleo-productivity shows a pronounced cyclicity
during the last 200,000 years, with most values
being higher values than in the Holocene. Periods
of higher productivity were probably also characterized by higher growth rates. The b-va1ues derived from bulk sediment olsN generally covary
with paleo-productivity (Fig. 7d) and seem to be
useful for considering growth rate effects. As seen
in Fig. 7e, there appears to be no clear glacial /
interglacial variation in the paleo-PC0 2 based on
alkenone Ep and variable b-values. According to this
reconstruction, the surface waters of the Angola
Basin were a stronger oceanic CO 2 source during
glacial than during interglacial periods. At the last
glacial maximum (LGM), this CO 2 source was
about a factor of 3 stronger than during the Holocene, despite the enhanced flux of carbon out of
the photic zone due to higher productivity during
glacial stages. This is in contrast to the results of
MUlier et al. (1994) which indicate a weaker CO 2
source during glacial periods due to higher biological productivity. Their estimates are consistent with
Andersen et al.
til
o
"-26
-24
l-22
-20
GeoB 1016-3
t;
1.11
t;
5.2
Ealkenone = 4.2 %0
i(
, 9.
+ alkenone producers
to. f>'
<) bulk
-18 +-~---,--,--,--,---,--,--,--,-----,
40
80
120
160
200
age [ka[
Fig. 6. Comparison between the .s 1J C values of C 37 • 2
alkenones and of bulk organic carbon in core GeoB
1016-3 from the Angola Basin. Oxygen isotope stages
are indicated by numbers. The vertical lines reflect the
standard errors of the means. To approximate the .s 1J C
value of total organic carbon from the alkenone producers, alkenone .s 1J C was corrected by E,,,,,,", = 4.2 %0 to
higher values (according to Popp et al. 1998a).
peG 2 Reconstruction
The results from three different ways of reconstructing paleo-PC0 2 in surface water of the
Angola Basin are shown in Figure 7. One reconstruction (Fig. 7a) is based on the isotopic composition oftotal organic carbon (MUller et al. 1994),
the other two are based on alkenone E either usp
ing a constant b-value (Fig. 7c) or variable b-values derived from bulk sediment ol5N (Fig. 7e).
For all three reconstructions we used the same
foraminifera Ol3C and alkenone SST data (MUller
et al. 1994).
Compared to the atmospheric pC0 2 record of
the Vostok ice-core (Barnola et al. 1987; louzel et
al. 1993), each reconstruction characterizes the
surface water ofthe Angola Basin as a permanent
oceanic source for CO 2 during the last 200,000
years. Major differences occur in the amplitude of
glacial/interglacial PC0 2 variations. The largest
differences between glacial and interglacial periods are obtained using the bulk organic carbono 13 C
(Fig. 7a). Similarto the atmosphericpC0 2 record,
this reconstruction shows prominent periods with
lowered values during isotope stages 2 - 4 and stage
6. According to this reconstruction, the Angola
Basin was a weaker CO 2 -source during glacial
periods than during the Holocene. MUller et al.
(1994) concluded that this is a result of higher biological productivity and enhanced flux of carbon out
ofthe photic zone during glacial periods.
Assuming that the Holocene b-value is also
representative of the last 200,000 years (b = constant), the reconstruction of PC0 2 using alkenone
Ep (Fig. 7c) generally confirms thePC0 2 variations
deduced from the bulk olJC record (Fig. 7a).
Larger differences of up to I 00 ~atm occur only
during isotope stage 6.
The above approaches did not take into consideration the effect of changing growth rates on isotopic composition of phytoplankton, although there
is evidence for large variations in paleo-productivity and ol5N implying that growth rates should also
have varied. On the left side of Fig. 7, the b-values
are compared to the paleo-productivity (Schneider
1991), which was estimated from accumulation
rates of total organic carbon according to the relationship of MUller and Suess (1979). The record of
paleo-productivity shows a pronounced cyclicity
during the last 200,000 years, with most values
being higher values than in the Holocene. Periods
of higher productivity were probably also characterized by higher growth rates. The b-va1ues derived from bulk sediment olsN generally covary
with paleo-productivity (Fig. 7d) and seem to be
useful for considering growth rate effects. As seen
in Fig. 7e, there appears to be no clear glacial /
interglacial variation in the paleo-PC0 2 based on
alkenone Ep and variable b-values. According to this
reconstruction, the surface waters of the Angola
Basin were a stronger oceanic CO 2 source during
glacial than during interglacial periods. At the last
glacial maximum (LGM), this CO 2 source was
about a factor of 3 stronger than during the Holocene, despite the enhanced flux of carbon out of
the photic zone due to higher productivity during
glacial stages. This is in contrast to the results of
MUlier et al. (1994) which indicate a weaker CO 2
source during glacial periods due to higher biological productivity. Their estimates are consistent with