

Alkenone O"C as a Proxy for Past PC0 2 in Surface Waters
479
140
120
E-Atlantic
~
l
a)
ill
100
"iii
.6 80
0°
W-Atlantic
60
0.0
0.2
0.4
0.6
0.8
1.0
PO,10-50mj I~M'l
12
++
10
<;,
~
. •
l
+-q.
+Ib)
~
Q
o 00
+
4- +
W-Atlantic
0.0
0.2
0.4
0.6
0.8
1.0
PO,IO-SOmj I~M'l
140
~
120
E-Atlantic
c)
!"2=O.750;n=6
l
('2= 0.925; n::: 7
ill
100
"iii
G:J
.6 80
00
central
W-Atlantic
Atlantic
60
8
10
12
8 15N {%. air]
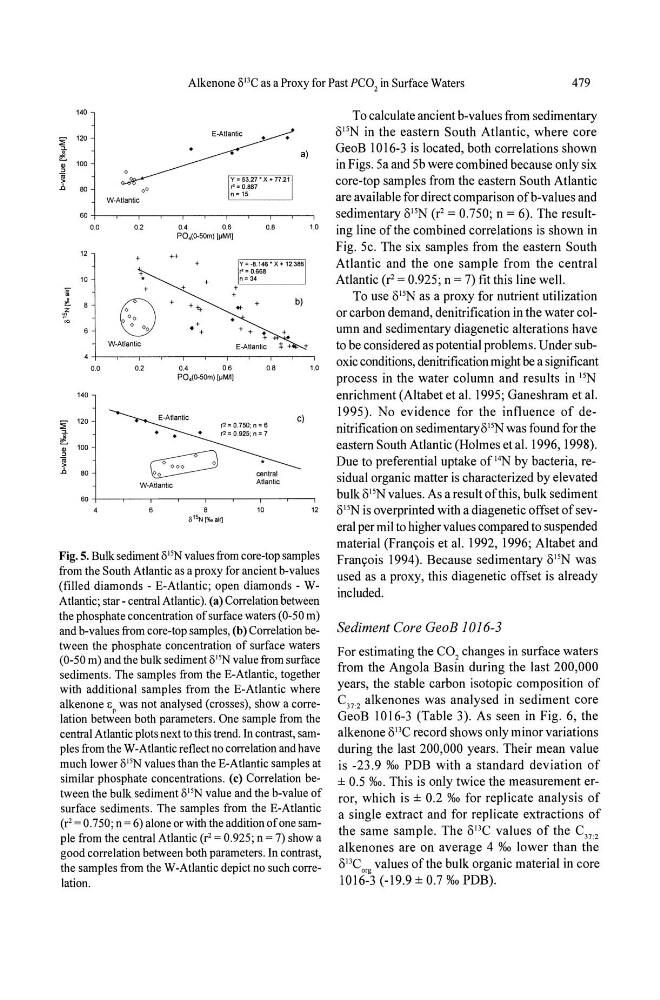
Fig. 5. Bulk sediment o15N values from core-top samples
from the South Atlantic as a proxy for ancient b-values
(filled diamonds - E-Atlantic; open diamonds - WAtlantic; star - central Atlantic). (a) Correlation between
the phosphate concentration of surface waters (0-50 m)
and b-values from core-top samples, (b) Correlation between the phosphate concentration of surface waters
(0-50 m) and the bulk sediment 8"N value from surface
sediments_ The samples from the E-Atlantic, together
with additional samples from the E-Atlantic where
alkenone E" was not analysed (crosses), show a correlation between both parameters. One sample from the
central Atlantic plots next to this trend. In contrast, samples from the W-Atlantic reflect no correlation and have
much lower Ol5N values than the E-Atlantic samples at
similar phosphate concentrations. (c) Correlation between the bulk sediment 8 15 N value and the b-value of
surface sediments. The samples from the E-Atlantic
(r 2 = 0_750; n = 6) alone or with the addition of one sample from the central Atlantic (r2 = 0.925; n = 7) show a
good correlation between both parameters. In contrast,
the samples from the W-Atlantic depict no such correlation.
To calculate ancient b-values from sedimentary
ol5N in the eastern South Atlantic, where core
GeoB 1016-3 is located, both correlations shown
in Figs. Sa and Sb were combined because only six
core-top samples from the eastern South Atlantic
are available for direct comparison ofb-values and
sedimentary ol5N (r 2 = 0.7S0; n = 6). The resulting line of the combined correlations is shown in
Fig. Sc. The six samples from the eastern South
Atlantic and the one sample from the central
Atlantic (r' = 0.925; n = 7) fit this line well.
To use ol5N as a proxy for nutrient utilization
or carbon demand, denitrification in the water column and sedimentary diagenetic alterations have
to be considered as potential problems. Under suboxic conditions, denitrification might be a significant
process in the water column and results in 15N
enrichment (Altabet et al. 1995; Ganeshram et al.
1995). No evidence for the influence of denitrification on sedimentaryol5N was found for the
eastern South Atlantic (Holmes et al. 1996, 1998).
Due to preferential uptake of 14N by bacteria, residual organic matter is characterized by elevated
bulk ol5N values. As a result of this, bulk sediment
~)15N is overprinted with a diagenetic offset of several per mil to higher values compared to suspended
material (Franyois et al. 1992, 1996; Altabet and
Franyois 1994). Because sedimentary ol5N was
used as a proxy, this diagenetic offset is already
included.
Sediment Core GeoB 1016-3
For estimating the CO 2 changes in surface waters
from the Angola Basin during the last 200,000
years, the stable carbon isotopic composition of
C 37 • 2 alkenones was analysed in sediment core
GeoB 1016-3 (Table 3). As seen in Fig. 6, the
alkenone OIlC record shows only minor variations
during the last 200,000 years. Their mean value
is -23.9 %0 PDB with a standard deviation of
± 0.5 %0. This is only twice the measurement error, which is ± 0.2 %0 for replicate analysis of
a single extract and for replicate extractions of
the same sample. The 013C values of the C 372
alkenones are on average 4 %0 lower than the
OIlC"g values of the bulk organic material in core
1016-3 (-19.9 ± 0.7 %0 PDB).
479
140
120
E-Atlantic
~
l
a)
ill
100
"iii
.6 80
0°
W-Atlantic
60
0.0
0.2
0.4
0.6
0.8
1.0
PO,10-50mj I~M'l
12
++
10
<;,
~
. •
l
+-q.
+Ib)
~
Q
o 00
+
4- +
W-Atlantic
0.0
0.2
0.4
0.6
0.8
1.0
PO,IO-SOmj I~M'l
140
~
120
E-Atlantic
c)
!"2=O.750;n=6
l
('2= 0.925; n::: 7
ill
100
"iii
G:J
.6 80
00
central
W-Atlantic
Atlantic
60
8
10
12
8 15N {%. air]
Fig. 5. Bulk sediment o15N values from core-top samples
from the South Atlantic as a proxy for ancient b-values
(filled diamonds - E-Atlantic; open diamonds - WAtlantic; star - central Atlantic). (a) Correlation between
the phosphate concentration of surface waters (0-50 m)
and b-values from core-top samples, (b) Correlation between the phosphate concentration of surface waters
(0-50 m) and the bulk sediment 8"N value from surface
sediments_ The samples from the E-Atlantic, together
with additional samples from the E-Atlantic where
alkenone E" was not analysed (crosses), show a correlation between both parameters. One sample from the
central Atlantic plots next to this trend. In contrast, samples from the W-Atlantic reflect no correlation and have
much lower Ol5N values than the E-Atlantic samples at
similar phosphate concentrations. (c) Correlation between the bulk sediment 8 15 N value and the b-value of
surface sediments. The samples from the E-Atlantic
(r 2 = 0_750; n = 6) alone or with the addition of one sample from the central Atlantic (r2 = 0.925; n = 7) show a
good correlation between both parameters. In contrast,
the samples from the W-Atlantic depict no such correlation.
To calculate ancient b-values from sedimentary
ol5N in the eastern South Atlantic, where core
GeoB 1016-3 is located, both correlations shown
in Figs. Sa and Sb were combined because only six
core-top samples from the eastern South Atlantic
are available for direct comparison ofb-values and
sedimentary ol5N (r 2 = 0.7S0; n = 6). The resulting line of the combined correlations is shown in
Fig. Sc. The six samples from the eastern South
Atlantic and the one sample from the central
Atlantic (r' = 0.925; n = 7) fit this line well.
To use ol5N as a proxy for nutrient utilization
or carbon demand, denitrification in the water column and sedimentary diagenetic alterations have
to be considered as potential problems. Under suboxic conditions, denitrification might be a significant
process in the water column and results in 15N
enrichment (Altabet et al. 1995; Ganeshram et al.
1995). No evidence for the influence of denitrification on sedimentaryol5N was found for the
eastern South Atlantic (Holmes et al. 1996, 1998).
Due to preferential uptake of 14N by bacteria, residual organic matter is characterized by elevated
bulk ol5N values. As a result of this, bulk sediment
~)15N is overprinted with a diagenetic offset of several per mil to higher values compared to suspended
material (Franyois et al. 1992, 1996; Altabet and
Franyois 1994). Because sedimentary ol5N was
used as a proxy, this diagenetic offset is already
included.
Sediment Core GeoB 1016-3
For estimating the CO 2 changes in surface waters
from the Angola Basin during the last 200,000
years, the stable carbon isotopic composition of
C 37 • 2 alkenones was analysed in sediment core
GeoB 1016-3 (Table 3). As seen in Fig. 6, the
alkenone OIlC record shows only minor variations
during the last 200,000 years. Their mean value
is -23.9 %0 PDB with a standard deviation of
± 0.5 %0. This is only twice the measurement error, which is ± 0.2 %0 for replicate analysis of
a single extract and for replicate extractions of
the same sample. The 013C values of the C 372
alkenones are on average 4 %0 lower than the
OIlC"g values of the bulk organic material in core
1016-3 (-19.9 ± 0.7 %0 PDB).