

478
Andersen et al.
surface waters is calculated for surface sediments
from the equatorial and South Atlantic:
b ~ 53.27 • [PO.lo.sorn + 77.21 n ~ 15; r' ~ 0.887
(7)
A similar relationship was reported for suspended particulate matter from several marine regions (Bidigare et a1. 1997). The b-P0 4 slopes of
16
"
!!
Q.
,.
to
13
12
0.0
16
15
!!
Q.
1.
to
13
0.08
• •
••
•••
•
0.2
"' ... 6"
',~
0.09
•
~ = 0.892
n= 15
a)
•
•
•
0.4
0.6
PO" (O-SOm) bJM)
... ,6~
• ... ~}'o
•• ,
,+
0.10
0.11
1/c,,[~M·'1
0.8
b)
...... 6~
, ,00
+. 'I . . .
0.12
1.0
0.13
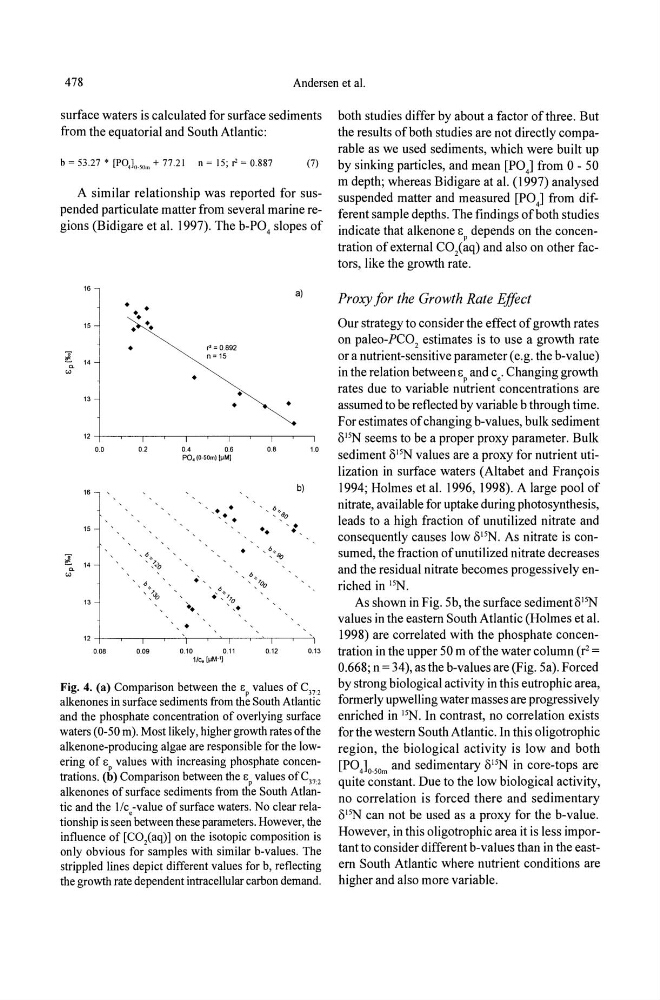
Fig. 4. (a) Comparison between the Ep values of C m
alkenones in surface sediments from the South Atlantic
and the phosphate concentration of overlying surface
waters (0-50 m). Most likely, higher growth rates of the
alkenone-producing algae are responsible for the lowering of Ep values with increasing phosphate concentrations. (b) Comparison between the Ep values ofC'7:'
alkenones of surface sediments from the South Atlantic and the lIc -value of surface waters. No clear relationship is see~ between these parameters. However, the
influence of [CO,(aq)] on the isotopic composition is
only obvious for samples with similar b-values. The
strippled lines depict different values for b, reflecting
the growth rate dependent intracellular carbon demand.
both studies differ by about a factor of three. But
the results of both studies are not directly comparable as we used sediments, which were built up
by sinking particles, and mean [PO.] from 0 - 50
m depth; whereas Bidigare at a1. (1997) analysed
suspended matter and measured [PO.] from different sample depths. The findings of both studies
indicate that alkenone Ep depends on the concentration of external CO 2 (aq) and also on other factors, like the growth rate.
Proxy for the Growth Rate Effect
Our strategy to consider the effect of growth rates
on paleo-PC0 2 estimates is to use a growth rate
or a nutrient-sensitive parameter (e.g. the b-value)
in the relation betweenE p and c .. Changing growth
rates due to variable nutrient concentrations are
assumed to be reflected by variable b through time.
For estimates of changing b-values, bulk sediment
8 1 SN seems to be a proper proxy parameter. Bulk
sediment 8 1S N values are a proxy for nutrient utilization in surface waters (Altabet and Franyois
1994; Holmes et a1. 1996, 1998). A large pool of
nitrate, available for uptake during photosynthesis,
leads to a high fraction of unutilized nitrate and
consequently causes low 8 1 SN. As nitrate is consumed, the fraction ofunutilized nitrate decreases
and the residual nitrate becomes progessively enriched in ISN .
As shown in Fig. 5b, the surface sediment8 1 SN
values in the eastern South Atlantic (Holmes et a1.
1998) are correlated with the phosphate concentration in the upper 50 m of the water column (r' =
0.668; n = 34), as the b-values are (Fig. Sa). Forced
by strong biological activity in this eutrophic area,
formerly upwelling water masses are progressively
enriched in ISN. In contrast, no correlation exists
for the western South Atlantic. In this oligotrophic
region, the biological activity is low and both
[PO.]o.som and sedimentary 8 1S N in core-tops are
quite constant. Due to the low biological activity,
no correlation is forced there and sedimentary
8 1 SN can not be used as a proxy for the b-value.
However, in this oligotrophic area it is less important to consider different b-values than in the eastern South Atlantic where nutrient conditions are
higher and also more variable.
Andersen et al.
surface waters is calculated for surface sediments
from the equatorial and South Atlantic:
b ~ 53.27 • [PO.lo.sorn + 77.21 n ~ 15; r' ~ 0.887
(7)
A similar relationship was reported for suspended particulate matter from several marine regions (Bidigare et a1. 1997). The b-P0 4 slopes of
16
"
!!
Q.
,.
to
13
12
0.0
16
15
!!
Q.
1.
to
13
0.08
• •
••
•••
•
0.2
"' ... 6"
',~
0.09
•
~ = 0.892
n= 15
a)
•
•
•
0.4
0.6
PO" (O-SOm) bJM)
... ,6~
• ... ~}'o
•• ,
,+
0.10
0.11
1/c,,[~M·'1
0.8
b)
...... 6~
, ,00
+. 'I . . .
0.12
1.0
0.13
Fig. 4. (a) Comparison between the Ep values of C m
alkenones in surface sediments from the South Atlantic
and the phosphate concentration of overlying surface
waters (0-50 m). Most likely, higher growth rates of the
alkenone-producing algae are responsible for the lowering of Ep values with increasing phosphate concentrations. (b) Comparison between the Ep values ofC'7:'
alkenones of surface sediments from the South Atlantic and the lIc -value of surface waters. No clear relationship is see~ between these parameters. However, the
influence of [CO,(aq)] on the isotopic composition is
only obvious for samples with similar b-values. The
strippled lines depict different values for b, reflecting
the growth rate dependent intracellular carbon demand.
both studies differ by about a factor of three. But
the results of both studies are not directly comparable as we used sediments, which were built up
by sinking particles, and mean [PO.] from 0 - 50
m depth; whereas Bidigare at a1. (1997) analysed
suspended matter and measured [PO.] from different sample depths. The findings of both studies
indicate that alkenone Ep depends on the concentration of external CO 2 (aq) and also on other factors, like the growth rate.
Proxy for the Growth Rate Effect
Our strategy to consider the effect of growth rates
on paleo-PC0 2 estimates is to use a growth rate
or a nutrient-sensitive parameter (e.g. the b-value)
in the relation betweenE p and c .. Changing growth
rates due to variable nutrient concentrations are
assumed to be reflected by variable b through time.
For estimates of changing b-values, bulk sediment
8 1 SN seems to be a proper proxy parameter. Bulk
sediment 8 1S N values are a proxy for nutrient utilization in surface waters (Altabet and Franyois
1994; Holmes et a1. 1996, 1998). A large pool of
nitrate, available for uptake during photosynthesis,
leads to a high fraction of unutilized nitrate and
consequently causes low 8 1 SN. As nitrate is consumed, the fraction ofunutilized nitrate decreases
and the residual nitrate becomes progessively enriched in ISN .
As shown in Fig. 5b, the surface sediment8 1 SN
values in the eastern South Atlantic (Holmes et a1.
1998) are correlated with the phosphate concentration in the upper 50 m of the water column (r' =
0.668; n = 34), as the b-values are (Fig. Sa). Forced
by strong biological activity in this eutrophic area,
formerly upwelling water masses are progressively
enriched in ISN. In contrast, no correlation exists
for the western South Atlantic. In this oligotrophic
region, the biological activity is low and both
[PO.]o.som and sedimentary 8 1S N in core-tops are
quite constant. Due to the low biological activity,
no correlation is forced there and sedimentary
8 1 SN can not be used as a proxy for the b-value.
However, in this oligotrophic area it is less important to consider different b-values than in the eastern South Atlantic where nutrient conditions are
higher and also more variable.