

Alkenone /i l3 C as a Proxy for Past PC0 2 in Surface Waters
477
Results and Discussion
Surface Sediments
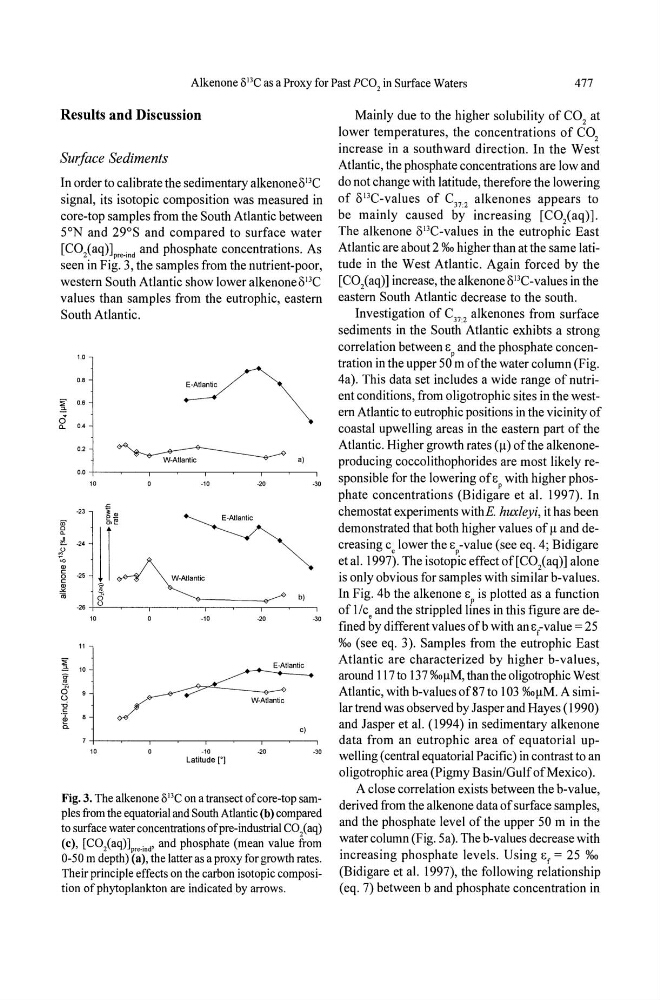
In order to calibrate the sedimentary alkenoneo l3 C
signal, its isotopic composition was measured in
core-top samples from the South Atlantic between
SON and 29°S and compared to surface water
[C0 2 (aq)]pre_ind and phosphate concentrations_ As
seen in Fig_ 3, the samples from the nutrient-poor,
western South Atlantic show lower alkenone Ol3C
values than samples from the eutrophic, eastern
South Atlantic_
1.0
0.8
,. 0.6
2a 0.4
"0.2
a)
0.0
10
-10
-20
-30
10
-10
-20
.... 0
11
~ 10
E-Atlantic
~ 9
U
W-Atlantic
-0
.~ 8
Co
c)
10
-10
-20
.... 0
Latitude [oJ
Figo 30 The alkenone /il3C on a transect of core-top samples from the equatorial and South Atlantic (b) compared
to surface water concentrations of pre-industrial CO 2( aq)
(c), [C0 2 (aq)]pre_ind' and phosphate (mean value from
0-50 m depth) (a), the latter as a proxy for growth rates.
Their principle effects on the carbon isotopic composition of phytoplankton are indicated by arrows.
Mainly due to the higher solubility of CO 2 at
lower temperatures, the concentrations of CO 2
increase in a southward direction. In the West
Atlantic, the phosphate concentrations are low and
do not change with latitude, therefore the lowering
of ol3C-values of C 372 alkenones appears to
be mainly caused by increasing [CO,(aq)].
The alkenone ol3C-values in the eutrophic East
Atlantic are about 2 %0 higher than at the same latitude in the West Atlantic. Again forced by the
[CO,(aq)] increase, the alkenone ol3C-values in the
eastern South Atlantic decrease to the south.
Investigation of C 37 : 2 alkenones from surface
sediments in the South Atlantic exhibts a strong
correlation between Ep and the phosphate concentration in the upper 50 m of the water column (Fig.
4a). This data set includes a wide range ofnutrient conditions, from oligotrophic sites in the western Atlantic to eutrophic positions in the vicinity of
coastal upwelling areas in the eastern part of the
Atlantic. Higher growth rates (j.l) ofthe alkenoneproducing coccolithophorides are most likely responsible for the lowering of Ep with higher phosphate concentrations (Bidigare et al. 1997). In
chemostat experiments withE. huxleyi, it has been
demonstrated that both higher values of j.l and decreasing c e lower the Ep-value (see eq. 4; Bidigare
et al. 1997). The isotopic effect of [C0 2 (aq)] alone
is only obvious for samples with similar b-values.
In Fig. 4b the alkenone Ep is plotted as a function
of liCe and the strippled lines in this figure are defined by different values ofb with an E{value = 25
%0 (see eq. 3). Samples from the eutrophic East
Atlantic are characterized by higher b-values,
around 117 to 137 %OJ.lM, than the oligotrophic West
Atlantic, with b-values of87 to 103 %OJ.lM. A similar trend was observed by Jasper and Hayes (1990)
and Jasper et al. (1994) in sedimentary alkenone
data from an eutrophic area of equatorial upwelling (central equatorial Pacific) in contrast to an
oligotrophic area (Pigmy Basin/Gulf of Mexico ).
A close correlation exists between the b-value,
derived from the alkenone data of surface samples,
and the phosphate level of the upper 50 m in the
water column (Fig. Sa). The b-values decrease with
increasing phosphate levels. Using E f = 25 %0
(Bidigare et al. 1997), the following relationship
(eq. 7) between b and phosphate concentration in
477
Results and Discussion
Surface Sediments
In order to calibrate the sedimentary alkenoneo l3 C
signal, its isotopic composition was measured in
core-top samples from the South Atlantic between
SON and 29°S and compared to surface water
[C0 2 (aq)]pre_ind and phosphate concentrations_ As
seen in Fig_ 3, the samples from the nutrient-poor,
western South Atlantic show lower alkenone Ol3C
values than samples from the eutrophic, eastern
South Atlantic_
1.0
0.8
,. 0.6
2a 0.4
"0.2
a)
0.0
10
-10
-20
-30
10
-10
-20
.... 0
11
~ 10
E-Atlantic
~ 9
U
W-Atlantic
-0
.~ 8
Co
c)
10
-10
-20
.... 0
Latitude [oJ
Figo 30 The alkenone /il3C on a transect of core-top samples from the equatorial and South Atlantic (b) compared
to surface water concentrations of pre-industrial CO 2( aq)
(c), [C0 2 (aq)]pre_ind' and phosphate (mean value from
0-50 m depth) (a), the latter as a proxy for growth rates.
Their principle effects on the carbon isotopic composition of phytoplankton are indicated by arrows.
Mainly due to the higher solubility of CO 2 at
lower temperatures, the concentrations of CO 2
increase in a southward direction. In the West
Atlantic, the phosphate concentrations are low and
do not change with latitude, therefore the lowering
of ol3C-values of C 372 alkenones appears to
be mainly caused by increasing [CO,(aq)].
The alkenone ol3C-values in the eutrophic East
Atlantic are about 2 %0 higher than at the same latitude in the West Atlantic. Again forced by the
[CO,(aq)] increase, the alkenone ol3C-values in the
eastern South Atlantic decrease to the south.
Investigation of C 37 : 2 alkenones from surface
sediments in the South Atlantic exhibts a strong
correlation between Ep and the phosphate concentration in the upper 50 m of the water column (Fig.
4a). This data set includes a wide range ofnutrient conditions, from oligotrophic sites in the western Atlantic to eutrophic positions in the vicinity of
coastal upwelling areas in the eastern part of the
Atlantic. Higher growth rates (j.l) ofthe alkenoneproducing coccolithophorides are most likely responsible for the lowering of Ep with higher phosphate concentrations (Bidigare et al. 1997). In
chemostat experiments withE. huxleyi, it has been
demonstrated that both higher values of j.l and decreasing c e lower the Ep-value (see eq. 4; Bidigare
et al. 1997). The isotopic effect of [C0 2 (aq)] alone
is only obvious for samples with similar b-values.
In Fig. 4b the alkenone Ep is plotted as a function
of liCe and the strippled lines in this figure are defined by different values ofb with an E{value = 25
%0 (see eq. 3). Samples from the eutrophic East
Atlantic are characterized by higher b-values,
around 117 to 137 %OJ.lM, than the oligotrophic West
Atlantic, with b-values of87 to 103 %OJ.lM. A similar trend was observed by Jasper and Hayes (1990)
and Jasper et al. (1994) in sedimentary alkenone
data from an eutrophic area of equatorial upwelling (central equatorial Pacific) in contrast to an
oligotrophic area (Pigmy Basin/Gulf of Mexico ).
A close correlation exists between the b-value,
derived from the alkenone data of surface samples,
and the phosphate level of the upper 50 m in the
water column (Fig. Sa). The b-values decrease with
increasing phosphate levels. Using E f = 25 %0
(Bidigare et al. 1997), the following relationship
(eq. 7) between b and phosphate concentration in