

418
Frank et al.
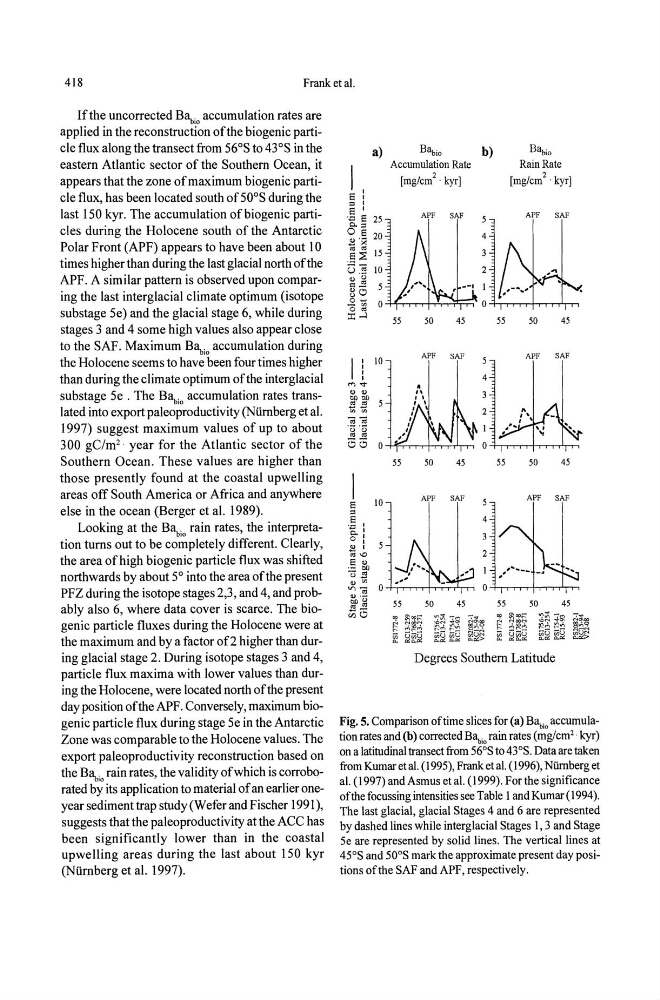
If the uncorrected B~. accumulation rates are
applied in the reconstructi~n ofthe biogenic particle flux along the transect from 56°S to 43°S in the
eastern Atlantic sector of the Southern Ocean, it
appears that the zone of maximum biogenic particle flux, has been located south of 50 0 S during the
last 150 kyr. The accumulation of biogenic particles during the Holocene south of the Antarctic
Polar Front (APF) appears to have been about 10
times higher than during the last glacial north ofthe
APF. A similar pattern is observed upon comparing the last interglacial climate optimum (isotope
substage 5e) and the glacial stage 6, while during
stages 3 and 4 some high values also appear close
to the SAF. Maximum Ba bio accumulation during
the Holocene seems to have been four times higher
than during the climate optimum of the interglacial
substage 5e . The Ba bio accumulation rates translated into export paleoproductivity (Niirnberg et al.
1997) suggest maximum values of up to about
300 gC/m 2 . year for the Atlantic sector of the
Southern Ocean. These values are higher than
those presently found at the coastal upwelling
areas off South America or Africa and anywhere
else in the ocean (Berger et al. 1989).
Looking at the B~io rain rates, the interpretation turns out to be completely different. Clearly,
the area of high biogenic particle flux was shifted
northwards by about 5° into the area of the present
PFZ during the isotope stages 2,3, and 4, and probably also 6, where data cover is scarce. The biogenic particle fluxes during the Holocene were at
the maximum and by a factor of2 higher than during glacial stage 2. During isotope stages 3 and 4,
particle flux maxima with lower values than during the Holocene, were located north ofthe present
day position of the APF. Conversely, maximum biogenic particle flux during stage 5e in the Antarctic
Zone was comparable to the Holocene values. The
export paleoproductivity reconstruction based on
the B~io rain rates, the validity of which is corroborated by its application to material of an earlier oneyear sediment trap study (Wefer and Fischer 1991),
suggests that the paleoproductivity at the ACC has
been significantly lower than in the coastal
upwelling areas during the last about 150 kyr
(Niirnberg et al. 1997).
a)
Babio
b)
Accumulation Rate
[mg/cm 2 . kyr]
5
~I'~"''''
,. --I 1
Ba bio
Rain Rate
[mg/cm 2 . kyr]
APF
SAF
~jWM' ~ ~
o
O""rri"T+rn
I i 10
"' ....
" "
Ei 5
--;:;ca
·~r~
55
50
45
55
APF
SAF
4
(3(3 O+'f':;""'~ho...,.',Jc,..,.,
55
50
45
55
50
45
APF
SAF
50
45
1 10 APF SAF 5 APF SAF
"Wtu
.§ ,
4
-,
~:
3
'"
5
~\O
2
S " .
__
~ .5
,l ......
"",' 1 ,1' ...... -- -...
... ...
Cl) t/'J
"",'
_
'" -;; 0
0
".ooG
'" '"
./1(3
55
50
45
55
50
Degrees Southern Latitude
45
Fig. 5. Comparison of time slices for (a) B~;o accumulation rates and (b) corrected B~io rain rates (mg! cm 2 . kyr)
on a latitudinal transect from 56°S to 43°S. Data are taken
from Kumar et al. (1995), Frank et al. (1996), NUrnberg et
al. (1997) and Asmus et al. (1999). For the significance
of the focussing intensities see Table 1 and Kumar (1994).
The last glacial, glacial Stages 4 and 6 are represented
by dashed lines while interglacial Stages 1,3 and Stage
5e are represented by solid lines. The vertical lines at
45°S and 50 0 S mark the approximate present day positions of the SAF and APF, respectively.
Frank et al.
If the uncorrected B~. accumulation rates are
applied in the reconstructi~n ofthe biogenic particle flux along the transect from 56°S to 43°S in the
eastern Atlantic sector of the Southern Ocean, it
appears that the zone of maximum biogenic particle flux, has been located south of 50 0 S during the
last 150 kyr. The accumulation of biogenic particles during the Holocene south of the Antarctic
Polar Front (APF) appears to have been about 10
times higher than during the last glacial north ofthe
APF. A similar pattern is observed upon comparing the last interglacial climate optimum (isotope
substage 5e) and the glacial stage 6, while during
stages 3 and 4 some high values also appear close
to the SAF. Maximum Ba bio accumulation during
the Holocene seems to have been four times higher
than during the climate optimum of the interglacial
substage 5e . The Ba bio accumulation rates translated into export paleoproductivity (Niirnberg et al.
1997) suggest maximum values of up to about
300 gC/m 2 . year for the Atlantic sector of the
Southern Ocean. These values are higher than
those presently found at the coastal upwelling
areas off South America or Africa and anywhere
else in the ocean (Berger et al. 1989).
Looking at the B~io rain rates, the interpretation turns out to be completely different. Clearly,
the area of high biogenic particle flux was shifted
northwards by about 5° into the area of the present
PFZ during the isotope stages 2,3, and 4, and probably also 6, where data cover is scarce. The biogenic particle fluxes during the Holocene were at
the maximum and by a factor of2 higher than during glacial stage 2. During isotope stages 3 and 4,
particle flux maxima with lower values than during the Holocene, were located north ofthe present
day position of the APF. Conversely, maximum biogenic particle flux during stage 5e in the Antarctic
Zone was comparable to the Holocene values. The
export paleoproductivity reconstruction based on
the B~io rain rates, the validity of which is corroborated by its application to material of an earlier oneyear sediment trap study (Wefer and Fischer 1991),
suggests that the paleoproductivity at the ACC has
been significantly lower than in the coastal
upwelling areas during the last about 150 kyr
(Niirnberg et al. 1997).
a)
Babio
b)
Accumulation Rate
[mg/cm 2 . kyr]
5
~I'~"''''
,. --I 1
Ba bio
Rain Rate
[mg/cm 2 . kyr]
APF
SAF
~jWM' ~ ~
o
O""rri"T+rn
I i 10
"' ....
" "
Ei 5
--;:;ca
·~r~
55
50
45
55
APF
SAF
4
(3(3 O+'f':;""'~ho...,.',Jc,..,.,
55
50
45
55
50
45
APF
SAF
50
45
1 10 APF SAF 5 APF SAF
"Wtu
.§ ,
4
-,
~:
3
'"
5
~\O
2
S " .
__
~ .5
,l ......
"",' 1 ,1' ...... -- -...
... ...
Cl) t/'J
"",'
_
'" -;; 0
0
".ooG
'" '"
./1(3
55
50
45
55
50
Degrees Southern Latitude
45
Fig. 5. Comparison of time slices for (a) B~;o accumulation rates and (b) corrected B~io rain rates (mg! cm 2 . kyr)
on a latitudinal transect from 56°S to 43°S. Data are taken
from Kumar et al. (1995), Frank et al. (1996), NUrnberg et
al. (1997) and Asmus et al. (1999). For the significance
of the focussing intensities see Table 1 and Kumar (1994).
The last glacial, glacial Stages 4 and 6 are represented
by dashed lines while interglacial Stages 1,3 and Stage
5e are represented by solid lines. The vertical lines at
45°S and 50 0 S mark the approximate present day positions of the SAF and APF, respectively.