

Sediment Redistribution, 23 0 Th" - Normalization and Implications for the Reconstruction of Particle Flux 417
0
0
20
40
60
80
100
120
140
} 160
.........
<:
200
220
240
260
280
300
320
Sediment Accumulation Rate and Vertical Particle Rain Rates (glcm 2 . kyr] Isotope
Stages
2 4 6 8 0 5
10 15
0 1 2 3 4 5 6 0
2
3 0 1 2 3 4
567 8
PSI 772-8
PSI 768-8
PS1756-5
P 1754-1
P '2082-1
55.3°
52.3°
46.5°
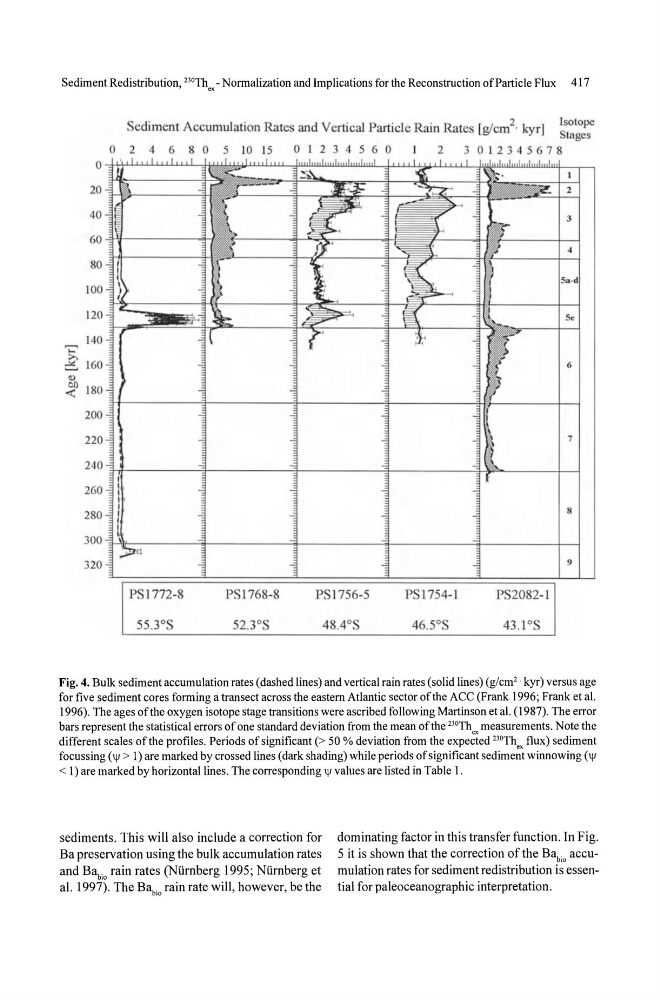
Fig. 4. Bulk sediment accumulation rates (dashed lines) and vertical rain rates (solid lines) (g/cm 2 . kyr) versus age
for five sediment cores forming a transect across the eastern Atlantic sector of the ACC (Frank 1996; Frank et al.
1996). The ages of the oxygen isotope stage transitions were ascribed following Martinson et at. (1987). The error
bars represent the statistical errors of one standard deviation from the mean of the 230Th measurements. Note the
different scales of the profiles. Periods of significant (> 50 % deviation from the expe~ted 230Th" flux) sediment
focussing (1jI > I) are marked by crossed lines (dark shading) while periods of significant sediment winnowing (1jI
< I) are marked by horizontal lines. The corresponding IjI values are listed in Table 1.
sediments. This will also include a correction for
Ba preservation using the bulk accumulation rates
and B~io rain rates (Niimberg 1995; Niimberg et
al. 1997). The Ba bio rain rate will, however, be the
dominating factor in this transfer function. In Fig.
S it is shown that the correction of the Ba hio accumulation rates for sediment redistribution is essential for paleoceanographic interpretation.
0
0
20
40
60
80
100
120
140
} 160
.........
<:
200
220
240
260
280
300
320
Sediment Accumulation Rate and Vertical Particle Rain Rates (glcm 2 . kyr] Isotope
Stages
2 4 6 8 0 5
10 15
0 1 2 3 4 5 6 0
2
3 0 1 2 3 4
567 8
PSI 772-8
PSI 768-8
PS1756-5
P 1754-1
P '2082-1
55.3°
52.3°
46.5°
Fig. 4. Bulk sediment accumulation rates (dashed lines) and vertical rain rates (solid lines) (g/cm 2 . kyr) versus age
for five sediment cores forming a transect across the eastern Atlantic sector of the ACC (Frank 1996; Frank et al.
1996). The ages of the oxygen isotope stage transitions were ascribed following Martinson et at. (1987). The error
bars represent the statistical errors of one standard deviation from the mean of the 230Th measurements. Note the
different scales of the profiles. Periods of significant (> 50 % deviation from the expe~ted 230Th" flux) sediment
focussing (1jI > I) are marked by crossed lines (dark shading) while periods of significant sediment winnowing (1jI
< I) are marked by horizontal lines. The corresponding IjI values are listed in Table 1.
sediments. This will also include a correction for
Ba preservation using the bulk accumulation rates
and B~io rain rates (Niimberg 1995; Niimberg et
al. 1997). The Ba bio rain rate will, however, be the
dominating factor in this transfer function. In Fig.
S it is shown that the correction of the Ba hio accumulation rates for sediment redistribution is essential for paleoceanographic interpretation.