

416
Frank et al.
30°...,.. ....... - ...... - _ ....... _-""""' _ _ _ 1..-_ ...
o ISO-Stage or
Sub·
Period
2
2/3-3.13
3.13-3/4
4
4/5-5.4
5.4-5/6
5/6-6.4
6.4-6/7
6/7-7.4
7.4·7/8
8
Subantarctic Zone
-----~~400
eV22-108
ePa1754
r-..::::=---. . . . . . . . . . . ; . ; ; . -; ..... GlJ!!ISI-.~150°
Antarctic Zone
Age,
Focussing Factor IjI
(kyr B.P.)
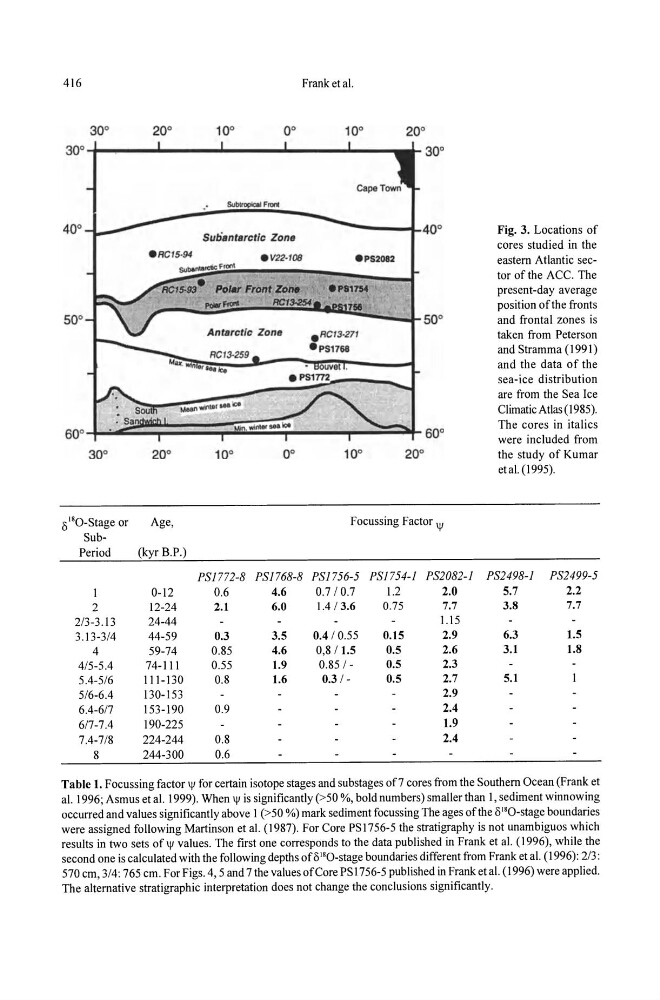
Fig. 3. Locations of
cores studied in the
eastern Atlantic sector of the ACC. The
present-day average
position of the fronts
and frontal zones is
taken from Peterson
and Stram rna (1991)
and the data of the
sea-ice distribution
are from the Sea Ice
Climatic Atlas (1985).
The cores in italics
were included from
the study of Kumar
et al. (1995).
PSI772-8 PS1768-8 PS1756-5 PSI 754·j PS2082-I PS2498-I PS2499-5
2.2
7.7
0-12
12-24
24-44
44-59
59-74
74-111
111·130
130-153
153-190
190-225
224·244
244-300
0.6
4.6
0.7 / 0.7
1.2
2.0
5.7
2.1
0.3
0.85
0.55
0.8
0.9
0.8
0.6
6.0
3.5
4.6
1.9
1.6
1.4 / 3.6
0.4 / 0.55
0,8/ 1.5
0.85 / -
0.3/0.75
0.15
0.5
0.5
0.5
7.7
l.15
2.9
2.6
2.3
2.7
2.9
2.4
1.9
2.4
3.8
6.3
3.1
5.1
1.5
1.8
Table 1. Focussing factor IjI for certain isotope stages and substages of7 cores from the Southern Ocean (Frank et
al. 1996; Asmus etal. 1999). When IjI is significantly (>50 % , bold numbers) smaller than I, sediment winnowing
occurred and values significantly above 1 ( >50 %) mark sediment focussing The ages ofthe olSO-stage boundaries
were assigned following Martinson et al. (1987). For Core PS 1756·5 the stratigraphy is not unambiguos which
results in two sets of IjI values. The first one corresponds to the data published in Frank et al. (1996), while the
second one is calculated with the following depths of ol SO-stage boundaries different from Frank et al. (1996): 2/3:
570 cm, 3/4: 765 cm. For Figs. 4, 5 and 7 the values of Core PS1756-5 published in Frank et al. (1996) were applied.
The alternative stratigraphic interpretation does not change the conclusions significantly.
Frank et al.
30°...,.. ....... - ...... - _ ....... _-""""' _ _ _ 1..-_ ...
o ISO-Stage or
Sub·
Period
2
2/3-3.13
3.13-3/4
4
4/5-5.4
5.4-5/6
5/6-6.4
6.4-6/7
6/7-7.4
7.4·7/8
8
Subantarctic Zone
-----~~400
eV22-108
ePa1754
r-..::::=---. . . . . . . . . . . ; . ; ; . -; ..... GlJ!!ISI-.~150°
Antarctic Zone
Age,
Focussing Factor IjI
(kyr B.P.)
Fig. 3. Locations of
cores studied in the
eastern Atlantic sector of the ACC. The
present-day average
position of the fronts
and frontal zones is
taken from Peterson
and Stram rna (1991)
and the data of the
sea-ice distribution
are from the Sea Ice
Climatic Atlas (1985).
The cores in italics
were included from
the study of Kumar
et al. (1995).
PSI772-8 PS1768-8 PS1756-5 PSI 754·j PS2082-I PS2498-I PS2499-5
2.2
7.7
0-12
12-24
24-44
44-59
59-74
74-111
111·130
130-153
153-190
190-225
224·244
244-300
0.6
4.6
0.7 / 0.7
1.2
2.0
5.7
2.1
0.3
0.85
0.55
0.8
0.9
0.8
0.6
6.0
3.5
4.6
1.9
1.6
1.4 / 3.6
0.4 / 0.55
0,8/ 1.5
0.85 / -
0.3/0.75
0.15
0.5
0.5
0.5
7.7
l.15
2.9
2.6
2.3
2.7
2.9
2.4
1.9
2.4
3.8
6.3
3.1
5.1
1.5
1.8
Table 1. Focussing factor IjI for certain isotope stages and substages of7 cores from the Southern Ocean (Frank et
al. 1996; Asmus etal. 1999). When IjI is significantly (>50 % , bold numbers) smaller than I, sediment winnowing
occurred and values significantly above 1 ( >50 %) mark sediment focussing The ages ofthe olSO-stage boundaries
were assigned following Martinson et al. (1987). For Core PS 1756·5 the stratigraphy is not unambiguos which
results in two sets of IjI values. The first one corresponds to the data published in Frank et al. (1996), while the
second one is calculated with the following depths of ol SO-stage boundaries different from Frank et al. (1996): 2/3:
570 cm, 3/4: 765 cm. For Figs. 4, 5 and 7 the values of Core PS1756-5 published in Frank et al. (1996) were applied.
The alternative stratigraphic interpretation does not change the conclusions significantly.