

350
Gingele et al.
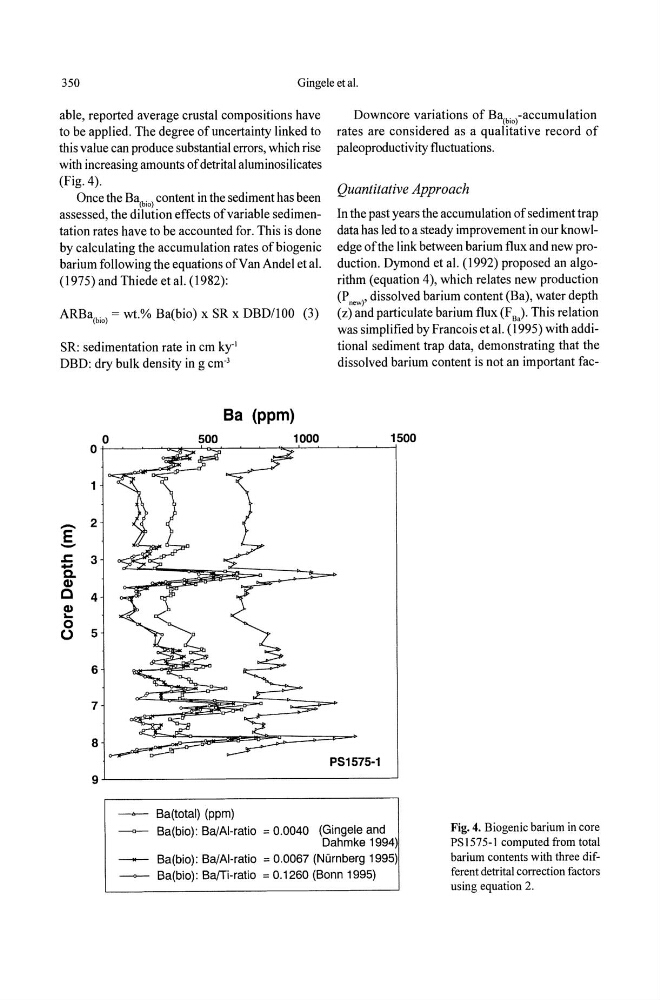
able, reported average crustal compositions have
to be applied. The degree of uncertainty linked to
this value can produce substantial errors, which rise
with increasing amounts of detrital aluminosilicates
(Fig. 4).
Once the Ba(b;O) content in the sediment has been
assessed, the dilution effects of variable sedimentation rates have to be accounted for. This is done
by calculating the accumulation rates of biogenic
barium following the equations of V an Andel et at.
(1975) and Thiede et at. (1982):
ARBa(b;O) = wt.% Ba(bio) x SR x DBDIlOO (3)
SR: sedimentation rate in cm ky"
DBD: dry bulk density in g cm- 3
8a (ppm)
500
1000
-
2
E
- .s:: 3
.. c.. Q)
C
4
Q)
....
0
0
5
6
7
8
9
Ba(total) (ppm)
Downcore variations of Ba(b;O)-accumulation
rates are considered as a qualitative record of
paleoproductivity fluctuations.
Quantitative Approach
In the past years the accumulation of sediment trap
data has led to a steady improvement in our knowledge of the I ink between barium flux and new production. Dymond et at. (1992) proposed an algorithm (equation 4), which relates new production
(P new )' dissolved barium content (Ba), water depth
(z) and particulate barium flux (F BJ This relation
was simplified by Francois et at. (1995) with additional sediment trap data, demonstrating that the
dissolved barium content is not an important fac1500
PS1575-1
Ba(bio): Ba/AI-ratio = 0.0040 (Gingele and
Dahmke 1994)
Fig. 4. Biogenic barium in core
PS1575-1 computed from total
barium contents with three different detrital correction factors
using equation 2.
Ba(bio): Ba/AI-ratio = 0.0067 (Nurnberg 1995)
Ba(bio): Ba/Ti-ratio = 0.1260 (Bonn 1995)
Gingele et al.
able, reported average crustal compositions have
to be applied. The degree of uncertainty linked to
this value can produce substantial errors, which rise
with increasing amounts of detrital aluminosilicates
(Fig. 4).
Once the Ba(b;O) content in the sediment has been
assessed, the dilution effects of variable sedimentation rates have to be accounted for. This is done
by calculating the accumulation rates of biogenic
barium following the equations of V an Andel et at.
(1975) and Thiede et at. (1982):
ARBa(b;O) = wt.% Ba(bio) x SR x DBDIlOO (3)
SR: sedimentation rate in cm ky"
DBD: dry bulk density in g cm- 3
8a (ppm)
500
1000
-
2
E
- .s:: 3
.. c.. Q)
C
4
Q)
....
0
0
5
6
7
8
9
Ba(total) (ppm)
Downcore variations of Ba(b;O)-accumulation
rates are considered as a qualitative record of
paleoproductivity fluctuations.
Quantitative Approach
In the past years the accumulation of sediment trap
data has led to a steady improvement in our knowledge of the I ink between barium flux and new production. Dymond et at. (1992) proposed an algorithm (equation 4), which relates new production
(P new )' dissolved barium content (Ba), water depth
(z) and particulate barium flux (F BJ This relation
was simplified by Francois et at. (1995) with additional sediment trap data, demonstrating that the
dissolved barium content is not an important fac1500
PS1575-1
Ba(bio): Ba/AI-ratio = 0.0040 (Gingele and
Dahmke 1994)
Fig. 4. Biogenic barium in core
PS1575-1 computed from total
barium contents with three different detrital correction factors
using equation 2.
Ba(bio): Ba/AI-ratio = 0.0067 (Nurnberg 1995)
Ba(bio): Ba/Ti-ratio = 0.1260 (Bonn 1995)