

330
Riihlemann etal.
..,.
'00
low productivity (1523-1) d ..,.
-
75
'00
300
:lOO
200
'00
'00
"
'00
2
' "
C ... lwl.%1
"
b
e
h
E '00
.00
300
()
""~-,,:>,'~"'~M·'
~~ "'" . . ' .. -. ...... - -,}_.
.!!!
"
~
300
,50
: ~
50
tl
::> 200
'00
-u
"
e Q.
'00
0
'50
Q)
030
... 000 075 000
c;;
0..
DBD(gem~1
C
350
'00
300
300
C .. -2
.'
:!"" ... '\. ·~r ,
-~
080-0..5
.J i
;,
'50
'50
,.
C.,-03
080-05
200
'00
.I'--.r
SR~.e
50
,50
'50
.,
l .'
,,..:
..•...
• 00
,.
'00
,.5
50
7,$
10.0
SR lem ko" 1
lime b ,p,
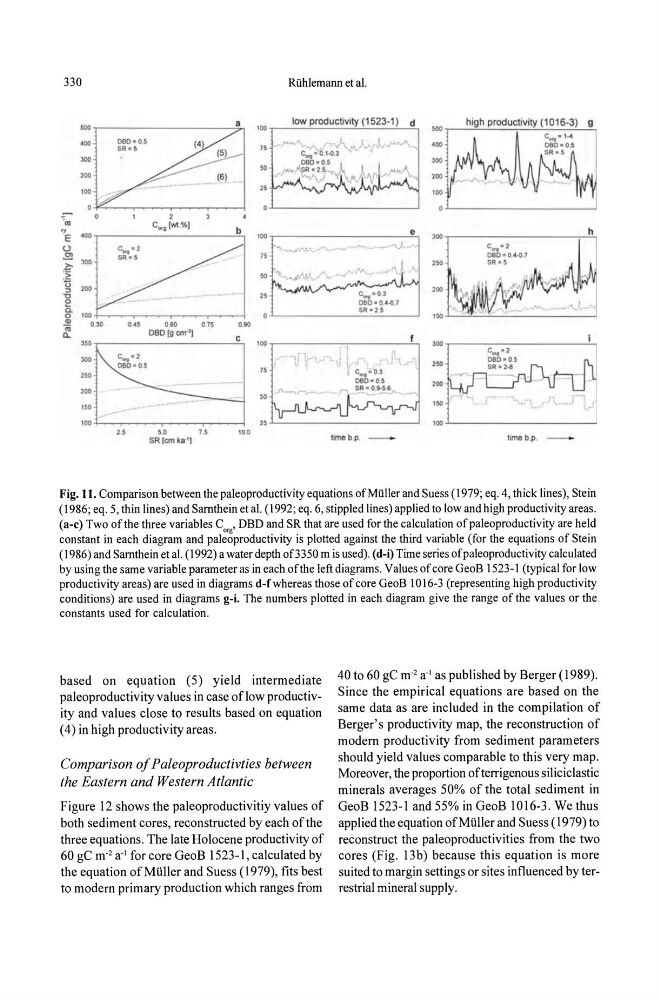
Fig. 11. Comparison between the paleoproductivity equations ofMiiller and Suess (1979; eq. 4, thick lines), Stein
(1986; eq. 5, thin lines) and Samthein et al. (\992; eq. 6, stippled lines) applied to low and high productivity areas.
(a-c) Two of the three variables CO,g' DBD and SR that are used for the calculation of paleoproductivity are held
constant in each diagram and paleoproductivity is plotted against the third variable (for the equations of Stein
(1986) and Samthein et al. (1992) a water depth of3350 m is used). (d-i) Time series of paleoproductivity calculated
by using the same variable parameter as in each of the left diagrams. Values of core GeoB 1523-1 (typical for low
productivity areas) are used in diagrams d-fwhereas those of core GeoB \0\6-3 (representing high productivity
conditions) are used in diagrams g-i. The numbers plotted in each diagram give the range of the values or the
constants used for calculation.
based on equation (5) yield intermediate
paleoproductivity values in case of low productivity and values close to results based on equation
(4) in high productivity areas.
Comparison of Paleoproductivties between
the Eastern and Western Atlantic
Figure 12 shows the paleoproductivitiy values of
both sediment cores, reconstructed by each of the
three equations. The late Holocene productivity of
60 gC m- 2 a-I for core GeoB 1523-1, calculated by
the equation ofMiiller and Suess (1979), fits best
to modern primary production which ranges from
40 to 60 gC m· 2 a· 1 as published by Berger (1989).
Since the empirical equations are based on the
same data as are included in the compilation of
Berger's productivity map, the reconstruction of
modern productivity from sediment parameters
should yield values comparable to this very map.
Moreover, the proportion of terrigenous siliciclastic
minerals averages 50% of the total sediment in
GeoB 1523-1 and 55% in GeoB 1016-3. We thus
applied the equation ofMiiller and Suess (1979) to
reconstruct the paleoproductivities from the two
cores (Fig. 13b) because this equation is more
suited to margin settings or sites influenced by terrestrial mineral supply.
Riihlemann etal.
..,.
'00
low productivity (1523-1) d ..,.
-
75
'00
300
:lOO
200
'00
'00
"
'00
2
' "
C ... lwl.%1
"
b
e
h
E '00
.00
300
()
""~-,,:>,'~"'~M·'
~~ "'" . . ' .. -. ...... - -,}_.
.!!!
"
~
300
,50
: ~
50
tl
::> 200
'00
-u
"
e Q.
'00
0
'50
Q)
030
... 000 075 000
c;;
0..
DBD(gem~1
C
350
'00
300
300
C .. -2
.'
:!"" ... '\. ·~r ,
-~
080-0..5
.J i
;,
'50
'50
,.
C.,-03
080-05
200
'00
.I'--.r
SR~.e
50
,50
'50
.,
l .'
,,..:
..•...
• 00
,.
'00
,.5
50
7,$
10.0
SR lem ko" 1
lime b ,p,
Fig. 11. Comparison between the paleoproductivity equations ofMiiller and Suess (1979; eq. 4, thick lines), Stein
(1986; eq. 5, thin lines) and Samthein et al. (\992; eq. 6, stippled lines) applied to low and high productivity areas.
(a-c) Two of the three variables CO,g' DBD and SR that are used for the calculation of paleoproductivity are held
constant in each diagram and paleoproductivity is plotted against the third variable (for the equations of Stein
(1986) and Samthein et al. (1992) a water depth of3350 m is used). (d-i) Time series of paleoproductivity calculated
by using the same variable parameter as in each of the left diagrams. Values of core GeoB 1523-1 (typical for low
productivity areas) are used in diagrams d-fwhereas those of core GeoB \0\6-3 (representing high productivity
conditions) are used in diagrams g-i. The numbers plotted in each diagram give the range of the values or the
constants used for calculation.
based on equation (5) yield intermediate
paleoproductivity values in case of low productivity and values close to results based on equation
(4) in high productivity areas.
Comparison of Paleoproductivties between
the Eastern and Western Atlantic
Figure 12 shows the paleoproductivitiy values of
both sediment cores, reconstructed by each of the
three equations. The late Holocene productivity of
60 gC m- 2 a-I for core GeoB 1523-1, calculated by
the equation ofMiiller and Suess (1979), fits best
to modern primary production which ranges from
40 to 60 gC m· 2 a· 1 as published by Berger (1989).
Since the empirical equations are based on the
same data as are included in the compilation of
Berger's productivity map, the reconstruction of
modern productivity from sediment parameters
should yield values comparable to this very map.
Moreover, the proportion of terrigenous siliciclastic
minerals averages 50% of the total sediment in
GeoB 1523-1 and 55% in GeoB 1016-3. We thus
applied the equation ofMiiller and Suess (1979) to
reconstruct the paleoproductivities from the two
cores (Fig. 13b) because this equation is more
suited to margin settings or sites influenced by terrestrial mineral supply.