

Kaolinite and Chlorite as Tracers of Modern and Late Quaternary Deep Water Circulation
305
0.5
0.4
0
~
0.3
a:
:c
()
0 .2
0
t1l
Holocene
Holocene
LGM
~
0 .1
(5-6 ka)
9-10 ka
(18-20 ka)
0.0
o 20 40 60 80 100 120 140 160 180 200 220
Depth (em)
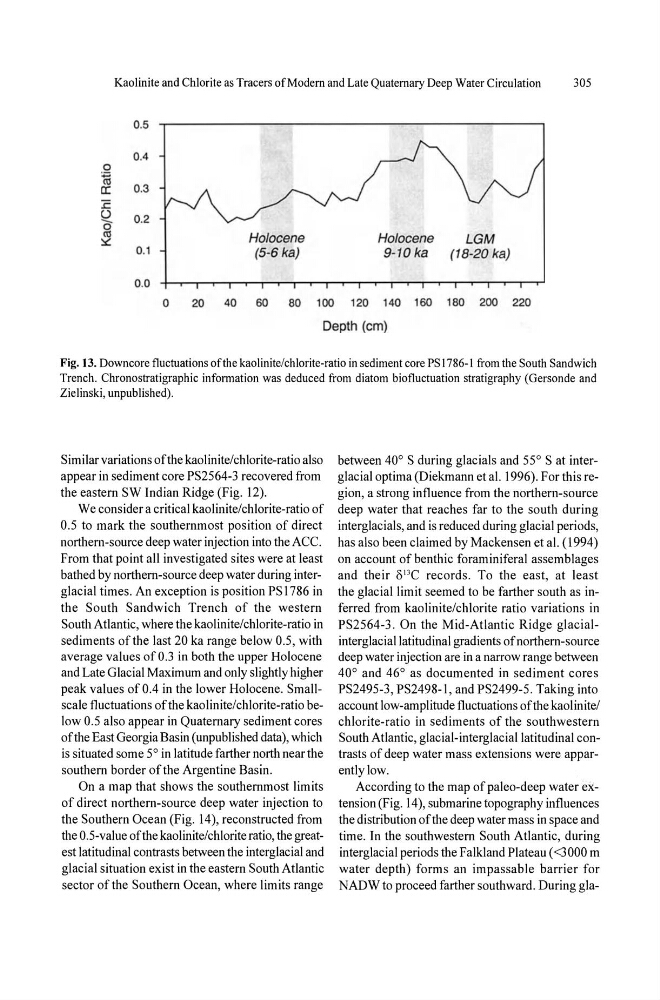
Fig. 13. Downcore fluctuations of the kaolinite/chlorite-ratio in sediment core PS 1786-1 from the South Sandwich
Trench. Chronostratigraphic information was deduced from diatom biofluctuation stratigraphy (Gersonde and
Zielinski, unpublished).
Similar variations of the kaolinite/chlorite-ratio also
appear in sediment core PS2564-3 recovered from
the eastern SW Indian Ridge (Fig. 12).
We consider a critical kaolinite/chlorite-ratio of
0.5 to mark the southernmost position of direct
northern-source deep water injection into the ACe.
From that point all investigated sites were at least
bathed by northern-source deep water during interglacial times. An exception is position PS 1786 in
the South Sandwich Trench of the western
South Atlantic, where the kaolinite/chlorite-ratio in
sediments of the last 20 ka range below 0.5, with
average values of 0.3 in both the upper Holocene
and Late Glacial Maximum and only slightly higher
peak values of 0.4 in the lower Holocene. Smallscale fluctuations of the kaolinite/chlorite-ratio below 0.5 also appear in Quaternary sediment cores
of the East Georgia Basin (unpublished data), which
is situated some 5° in latitude farther north near the
southern border of the Argentine Basin.
On a map that shows the southernmost limits
of direct northern-source deep water injection to
the Southern Ocean (Fig. 14), reconstructed from
tile 0.5-value ofthe kaolinite/chlorite ratio, the greatest latitudinal contrasts between the interglacial and
gl acial situation exist in the eastern South Atlantic
sector of the Southern Ocean, where limits range
between 40° S during glacials and 55° S at interglacial optima (Diekmann et at. 1996). For this region, a strong influence from the northern-source
deep water that reaches far to the south during
interglacials, and is reduced during glacial periods,
has also been claimed by Mackensen et at. (1994)
on account of benthic foraminiferal assemblages
and their O\3C record s. To the east, at least
the glacial limit seemed to be farther south as inferred from kaolinite/chlorite ratio variations in
PS2564-3. On the Mid-Atlantic Ridge glacialinterglacial latitudinal gradients of northern-source
deep water injection are in a narrow range between
40° and 46° as documented in sediment cores
PS2495-3 , PS2498-1 , and PS2499-5. Taking into
account low-amplitude fluctuations ofthe kaolinite/
chlorite-ratio in sediments of the southwestern
South Atlantic, glacial-interglacial latitudinal contrasts of deep water mass extensions were apparentlylow.
According to the map of paleo-deep water extension (Fig. 14), submarine topography influences
the distribution ofthe deep water mass in space and
time. In the southwestern South Atlantic, during
interglacial periods the Falkland Plateau «3000 m
water depth) forms an impassable barrier for
NADW to proceed farther southward. During gla-
305
0.5
0.4
0
~
0.3
a:
:c
()
0 .2
0
t1l
Holocene
Holocene
LGM
~
0 .1
(5-6 ka)
9-10 ka
(18-20 ka)
0.0
o 20 40 60 80 100 120 140 160 180 200 220
Depth (em)
Fig. 13. Downcore fluctuations of the kaolinite/chlorite-ratio in sediment core PS 1786-1 from the South Sandwich
Trench. Chronostratigraphic information was deduced from diatom biofluctuation stratigraphy (Gersonde and
Zielinski, unpublished).
Similar variations of the kaolinite/chlorite-ratio also
appear in sediment core PS2564-3 recovered from
the eastern SW Indian Ridge (Fig. 12).
We consider a critical kaolinite/chlorite-ratio of
0.5 to mark the southernmost position of direct
northern-source deep water injection into the ACe.
From that point all investigated sites were at least
bathed by northern-source deep water during interglacial times. An exception is position PS 1786 in
the South Sandwich Trench of the western
South Atlantic, where the kaolinite/chlorite-ratio in
sediments of the last 20 ka range below 0.5, with
average values of 0.3 in both the upper Holocene
and Late Glacial Maximum and only slightly higher
peak values of 0.4 in the lower Holocene. Smallscale fluctuations of the kaolinite/chlorite-ratio below 0.5 also appear in Quaternary sediment cores
of the East Georgia Basin (unpublished data), which
is situated some 5° in latitude farther north near the
southern border of the Argentine Basin.
On a map that shows the southernmost limits
of direct northern-source deep water injection to
the Southern Ocean (Fig. 14), reconstructed from
tile 0.5-value ofthe kaolinite/chlorite ratio, the greatest latitudinal contrasts between the interglacial and
gl acial situation exist in the eastern South Atlantic
sector of the Southern Ocean, where limits range
between 40° S during glacials and 55° S at interglacial optima (Diekmann et at. 1996). For this region, a strong influence from the northern-source
deep water that reaches far to the south during
interglacials, and is reduced during glacial periods,
has also been claimed by Mackensen et at. (1994)
on account of benthic foraminiferal assemblages
and their O\3C record s. To the east, at least
the glacial limit seemed to be farther south as inferred from kaolinite/chlorite ratio variations in
PS2564-3. On the Mid-Atlantic Ridge glacialinterglacial latitudinal gradients of northern-source
deep water injection are in a narrow range between
40° and 46° as documented in sediment cores
PS2495-3 , PS2498-1 , and PS2499-5. Taking into
account low-amplitude fluctuations ofthe kaolinite/
chlorite-ratio in sediments of the southwestern
South Atlantic, glacial-interglacial latitudinal contrasts of deep water mass extensions were apparentlylow.
According to the map of paleo-deep water extension (Fig. 14), submarine topography influences
the distribution ofthe deep water mass in space and
time. In the southwestern South Atlantic, during
interglacial periods the Falkland Plateau «3000 m
water depth) forms an impassable barrier for
NADW to proceed farther southward. During gla-