

Carbonate Dissolution in the Deep-Sea
275
Non-fragmented tests of sand-sized planktic
foraminifera (standardized on 100 %)
10~~------------------~~~~
oS!
o..i I
~~ ~
,,"; 0,0 f-:s ! '
7500 !
"
9 '
¢
,
'
50; ,
f-i 6~
;------------::-1-_ ., 0
100
CaC03 % (w/w)
¢
Transect 1 - Equatorial Atlantic
o
Transect 2
Walvis Ridge
<>
Transect 3 - Continental margin
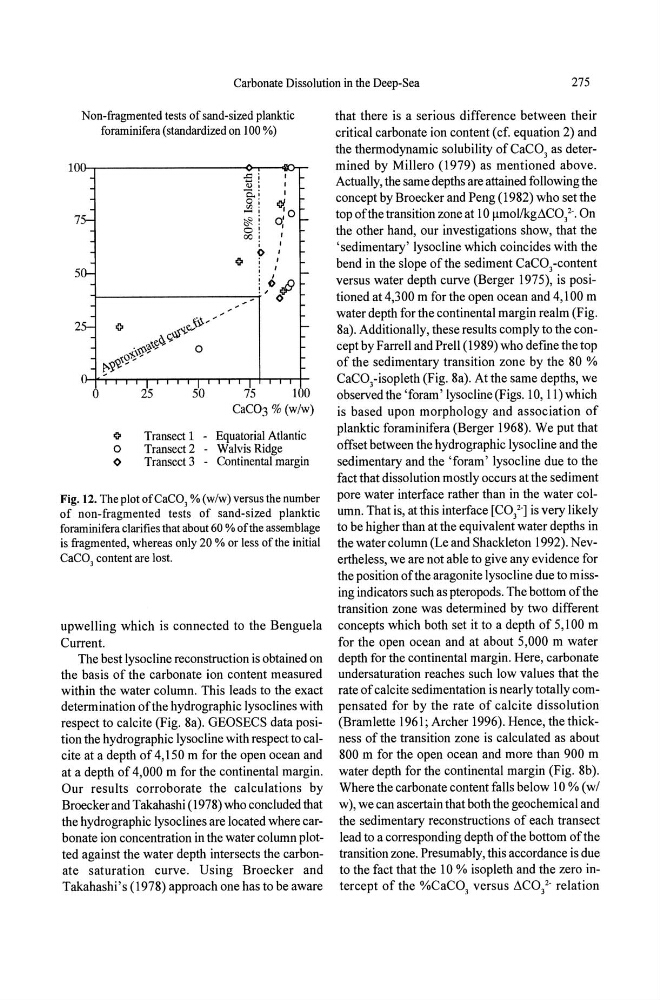
Fig. 12. The plot ofCaC0 3 % (w/w) versus the number
of non-fragmented tests of sand-sized planktic
foraminifera clarifies that about 60 % of the assemblage
is fragmented, whereas only 20 % or less of the initial
CaC0 3 content are lost.
upwelling which is connected to the Benguela
Current.
The best lysocline reconstruction is obtained on
the basis of the carbonate ion content measured
within the water column. This leads to the exact
determination ofthe hydrographic lysoclines with
respect to calcite (Fig. Sa). GEOSECS data position the hydrographic lysocline with respect to calcite at a depth of 4, 150 m for the open ocean and
at a depth of 4,000 m for the continental margin.
Our results corroborate the calculations by
Broecker and Takahashi (197S) who concluded that
the hydrographic lysoclines are located where carbonate ion concentration in the water column plotted against the water depth intersects the carbonate saturation curve. Using Broecker and
Takahashi's (197S) approach one has to be aware
that there is a serious difference between their
critical carbonate ion content (cf. equation 2) and
the thermodynamic solubility of CaC0 3 as determined by Millero (1979) as mentioned above.
Actually, the same depths are attained following the
concept by Broecker and Peng (19S2) who setthe
top of the transition zone at 10 f!mollkgilCO/·. On
the other hand, our investigations show, that the
'sedimentary' lysocline which coincides with the
bend in the slope of the sediment CaC0 3 -content
versus water depth curve (Berger 1975), is positioned at 4,300 m for the open ocean and 4,100 m
water depth for the continental margin realm (Fig.
Sa). Additionally, these results comply to the concept by Farrell and Prell (19S9) who define the top
of the sedimentary transition zone by the SO %
CaC0 3 -isopleth (Fig. Sa). At the same depths, we
observed the 'forarn' lysocline (Figs. 10, 11) which
is based upon morphology and association of
planktic foraminifera (Berger 1965). We put that
offset between the hydrographic lysocline and the
sedimentary and the 'foram' lysocline due to the
fact that dissolution mostly occurs at the sediment
pore water interface rather than in the water column. That is, atthis interface [COt] is very likely
to be higher than at the equivalent water depths in
the water column (Le and Shackleton 1992). Nevertheless, we are not able to give any evidence for
the position of the aragonite lysocline due to missing indicators such as pteropods. The bottom ofthe
transition zone was determined by two different
concepts which both set it to a depth of 5,100 m
for the open ocean and at about 5,000 m water
depth for the continental margin. Here, carbonate
undersaturation reaches such low values that the
rate of calcite sedimentation is nearly totally compensated for by the rate of calcite dissolution
(Bramlette 1961; Archer 1996). Hence, the thickness of the transition zone is calculated as about
SOO m for the open ocean and more than 900 m
water depth for the continental margin (Fig. Sb).
Where the carbonate content falls below 10 % (wi
w), we can ascertain that both the geochemical and
the sedimentary reconstructions of each transect
lead to a corresponding depth of the bottom ofthe
transition zone. Presumably, this accordance is due
to the fact that the 10 % isopleth and the zero intercept of the %CaC0 3 versus ilCO/" relation
275
Non-fragmented tests of sand-sized planktic
foraminifera (standardized on 100 %)
10~~------------------~~~~
oS!
o..i I
~~ ~
,,"; 0,0 f-:s ! '
7500 !
"
9 '
¢
,
'
50; ,
f-i 6~
;------------::-1-_ ., 0
100
CaC03 % (w/w)
¢
Transect 1 - Equatorial Atlantic
o
Transect 2
Walvis Ridge
<>
Transect 3 - Continental margin
Fig. 12. The plot ofCaC0 3 % (w/w) versus the number
of non-fragmented tests of sand-sized planktic
foraminifera clarifies that about 60 % of the assemblage
is fragmented, whereas only 20 % or less of the initial
CaC0 3 content are lost.
upwelling which is connected to the Benguela
Current.
The best lysocline reconstruction is obtained on
the basis of the carbonate ion content measured
within the water column. This leads to the exact
determination ofthe hydrographic lysoclines with
respect to calcite (Fig. Sa). GEOSECS data position the hydrographic lysocline with respect to calcite at a depth of 4, 150 m for the open ocean and
at a depth of 4,000 m for the continental margin.
Our results corroborate the calculations by
Broecker and Takahashi (197S) who concluded that
the hydrographic lysoclines are located where carbonate ion concentration in the water column plotted against the water depth intersects the carbonate saturation curve. Using Broecker and
Takahashi's (197S) approach one has to be aware
that there is a serious difference between their
critical carbonate ion content (cf. equation 2) and
the thermodynamic solubility of CaC0 3 as determined by Millero (1979) as mentioned above.
Actually, the same depths are attained following the
concept by Broecker and Peng (19S2) who setthe
top of the transition zone at 10 f!mollkgilCO/·. On
the other hand, our investigations show, that the
'sedimentary' lysocline which coincides with the
bend in the slope of the sediment CaC0 3 -content
versus water depth curve (Berger 1975), is positioned at 4,300 m for the open ocean and 4,100 m
water depth for the continental margin realm (Fig.
Sa). Additionally, these results comply to the concept by Farrell and Prell (19S9) who define the top
of the sedimentary transition zone by the SO %
CaC0 3 -isopleth (Fig. Sa). At the same depths, we
observed the 'forarn' lysocline (Figs. 10, 11) which
is based upon morphology and association of
planktic foraminifera (Berger 1965). We put that
offset between the hydrographic lysocline and the
sedimentary and the 'foram' lysocline due to the
fact that dissolution mostly occurs at the sediment
pore water interface rather than in the water column. That is, atthis interface [COt] is very likely
to be higher than at the equivalent water depths in
the water column (Le and Shackleton 1992). Nevertheless, we are not able to give any evidence for
the position of the aragonite lysocline due to missing indicators such as pteropods. The bottom ofthe
transition zone was determined by two different
concepts which both set it to a depth of 5,100 m
for the open ocean and at about 5,000 m water
depth for the continental margin. Here, carbonate
undersaturation reaches such low values that the
rate of calcite sedimentation is nearly totally compensated for by the rate of calcite dissolution
(Bramlette 1961; Archer 1996). Hence, the thickness of the transition zone is calculated as about
SOO m for the open ocean and more than 900 m
water depth for the continental margin (Fig. Sb).
Where the carbonate content falls below 10 % (wi
w), we can ascertain that both the geochemical and
the sedimentary reconstructions of each transect
lead to a corresponding depth of the bottom ofthe
transition zone. Presumably, this accordance is due
to the fact that the 10 % isopleth and the zero intercept of the %CaC0 3 versus ilCO/" relation