

Oxygen Isotope Values of Planktic Foraminifera
183
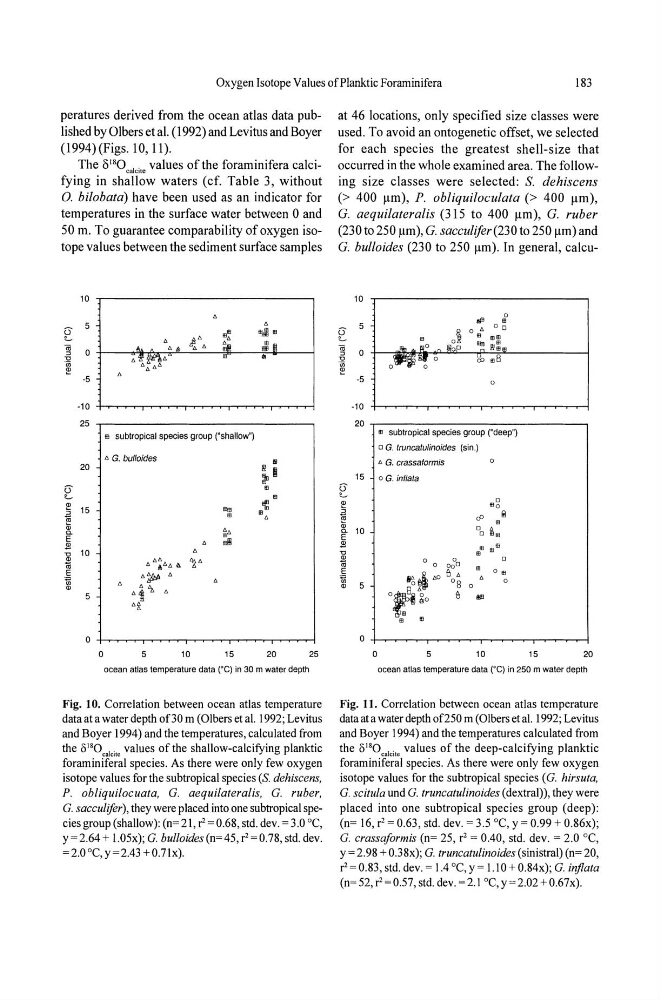
peratures derived from the ocean atlas data published by OIbers et al. (1992) and Levitus and Boyer
(1994)(Figs. 10, 11).
The 8 18 0""I.i'0 values of the foraminifera calcifying in shallow waters (cf. Table 3, without
0. bi/obata) have been used as an indicator for
temperatures in the surface water between 0 and
50 m. To guarantee comparability of oxygen isotope values between the sediment surface samples
10
5
~
U
~
'III"
.....
• ~' .
"iii
0
.A.
~"
~
IIh
"
~~~.
~
lit
I
~ ..
~
·5
·10
25
m subtropical species group ('shallow")
• G. bulla/des
..
20
II I
~
U
m
.....
m
i!! 15
me
"f,
~
"
•
Q)
~
C.
E
•
~
"0
10
~
Q)
~.
'2'
1ii
6 ,At::.. 6.
E
~'!ftI> ~
1ii
"
~
'1 'h
5
.*
0
0
5
10
15
20
25
ocean atlas temperature data (0C) in 30 m water depth
Fig. 10. Correlation between ocean atlas temperature
data at a water depth of30 m (Olbers et al. 1992; Levitus
and Boyer 1994) and the temperatures, calculated from
the I)I'O. a1dte values of the shallow-calcifying planktic
foraminiferal species. As there were only few oxygen
isotope values for the subtropical species (s. dehiscens,
P. obliquilocuata, G. aequilateralis, G. ruber,
G. sacculifor), they were placed into one subtropical species group (shallow): (n= 21, r = 0.68, std. dey. = 3.0 °C,
y=2.64+ 1.05x); G. bulloides(n=45,r=0.78, std. dey.
=2.0°C, Y =2.43+ 0.7Ix).
at 46 locations, only specified size classes were
used. To avoid an ontogenetic offset, we selected
for each species the greatest shell-size that
occurred in the whole examined area. The following size classes were selected: S. dehiscens
(> 400 11m), P. obliquiloculata (> 400 11m),
G. aequilateralis (315 to 400 11m), G. ruber
(230 to 250 11m), G. sacculifer(230 to 250 11m) and
G. bulla ides (230 to 250 11m). In general, caIcu10
rIB
0
5
m
u
~~!
o • 00
.....
m
· ""
"iii
0
-' "
,,-0
.., ~:"
"
o~~o
r<> .8
~
i!!
·5
0
·10
20
" subtropical species group ("deep")
o G. truncatu/inoides (sin.)
b. G. crassstormis
15
oG. inllata
U
.....
i!!
0
"0
iil
c9
il
Ii;
"
Do ~"
c. 10
E
~
fIJB IBm
"0
"
o
0
0
1ii
o 000
E
8'! i bO II ~
0"
'"
~
0
8l 5
of!
0 8 °
°t~
e
IIl!l
/10
"
" "
0
0
5
10
15
20
ocean atlas temperature data (0C) in 250 m water depth
Fig. 11. Correlation between ocean atlas temperature
data at a water depth of250 m (Olbers et al. 1992; Levitus
and Boyer 1994) and the temperatures calculated from
the I)I'O. a1dte values of the deep-calcifying planktic
foraminiferal species. As there were only few oxygen
isotope values for the subtropical species (G. hirsuta,
G. scitula und G. truncatulinoides (dextral», they were
placed into one subtropical species group (deep):
(n= 16, r = 0.63, std. dey. = 3.5 °C, Y = 0.99 + O.86x);
G. crassaformis (n= 25, r = 0.40, std. dey. = 2.0 DC,
y=2.98 + 0.38x); G. truncatulinoides (sinistral)(n=20,
r = 0.83, std. dey. = 1.4 °C, Y = 1.10 + 0.84x); G. inflata
(n=52,r=0.57, std. dey. =2.1 °C, y=2.02+0.67x).
183
peratures derived from the ocean atlas data published by OIbers et al. (1992) and Levitus and Boyer
(1994)(Figs. 10, 11).
The 8 18 0""I.i'0 values of the foraminifera calcifying in shallow waters (cf. Table 3, without
0. bi/obata) have been used as an indicator for
temperatures in the surface water between 0 and
50 m. To guarantee comparability of oxygen isotope values between the sediment surface samples
10
5
~
U
~
'III"
.....
• ~' .
"iii
0
.A.
~"
~
IIh
"
~~~.
~
lit
I
~ ..
~
·5
·10
25
m subtropical species group ('shallow")
• G. bulla/des
..
20
II I
~
U
m
.....
m
i!! 15
me
"f,
~
"
•
Q)
~
C.
E
•
~
"0
10
~
Q)
~.
'2'
1ii
6 ,At::.. 6.
E
~'!ftI> ~
1ii
"
~
'1 'h
5
.*
0
0
5
10
15
20
25
ocean atlas temperature data (0C) in 30 m water depth
Fig. 10. Correlation between ocean atlas temperature
data at a water depth of30 m (Olbers et al. 1992; Levitus
and Boyer 1994) and the temperatures, calculated from
the I)I'O. a1dte values of the shallow-calcifying planktic
foraminiferal species. As there were only few oxygen
isotope values for the subtropical species (s. dehiscens,
P. obliquilocuata, G. aequilateralis, G. ruber,
G. sacculifor), they were placed into one subtropical species group (shallow): (n= 21, r = 0.68, std. dey. = 3.0 °C,
y=2.64+ 1.05x); G. bulloides(n=45,r=0.78, std. dey.
=2.0°C, Y =2.43+ 0.7Ix).
at 46 locations, only specified size classes were
used. To avoid an ontogenetic offset, we selected
for each species the greatest shell-size that
occurred in the whole examined area. The following size classes were selected: S. dehiscens
(> 400 11m), P. obliquiloculata (> 400 11m),
G. aequilateralis (315 to 400 11m), G. ruber
(230 to 250 11m), G. sacculifer(230 to 250 11m) and
G. bulla ides (230 to 250 11m). In general, caIcu10
rIB
0
5
m
u
~~!
o • 00
.....
m
· ""
"iii
0
-' "
,,-0
.., ~:"
"
o~~o
r<> .8
~
i!!
·5
0
·10
20
" subtropical species group ("deep")
o G. truncatu/inoides (sin.)
b. G. crassstormis
15
oG. inllata
U
.....
i!!
0
"0
iil
c9
il
Ii;
"
Do ~"
c. 10
E
~
fIJB IBm
"0
"
o
0
0
1ii
o 000
E
8'! i bO II ~
0"
'"
~
0
8l 5
of!
0 8 °
°t~
e
IIl!l
/10
"
" "
0
0
5
10
15
20
ocean atlas temperature data (0C) in 250 m water depth
Fig. 11. Correlation between ocean atlas temperature
data at a water depth of250 m (Olbers et al. 1992; Levitus
and Boyer 1994) and the temperatures calculated from
the I)I'O. a1dte values of the deep-calcifying planktic
foraminiferal species. As there were only few oxygen
isotope values for the subtropical species (G. hirsuta,
G. scitula und G. truncatulinoides (dextral», they were
placed into one subtropical species group (deep):
(n= 16, r = 0.63, std. dey. = 3.5 °C, Y = 0.99 + O.86x);
G. crassaformis (n= 25, r = 0.40, std. dey. = 2.0 DC,
y=2.98 + 0.38x); G. truncatulinoides (sinistral)(n=20,
r = 0.83, std. dey. = 1.4 °C, Y = 1.10 + 0.84x); G. inflata
(n=52,r=0.57, std. dey. =2.1 °C, y=2.02+0.67x).