

184
Niebler et al.
lated surface water temperatures of all shallowcalcifYing species correlate well with the ocean atlas
temperature data from a water depth ono m (Fig.
10). But the residuals show that low temperatures
are overestimated and high temperatures are underestimated. This probably resulted from the oversimplified assumption that all species calcifY atthe
same time, wherefore the selected summer seasurface temperatures do not apply to the main seasonal flux of all species.
The deep-calcifying foraminifera (Table 3)
"store" temperatures from 250 m water depth and
deeper. Likewise to guarantee the comparability of
oxygen isotope values between the sediment surface samples at 52 locations, all deep-calcifying
species (G. hirsuta, G. scitula, G. crassaformis,
G. truncatulinoides (dextral and sinistral)) have
been measured in the size fraction 315 to 400 Ilm.
We also used the deep- I intermediate-calcifYing
species G. inflata (280 to 315 Ilm) to extend the
deep foraminiferal assemblage. The chosen shellsizes were the largest that occur in the whole examined area. The oJ80o.loite values of the deep-calcifying species were also corrected for their "oxy_
gen isotope disequilibrium" (Table 2) and subsequently converted into temperatures. Calculated
temperatures of the deep-calcifYing species correlate quite well with the ocean atlas temperature
data derived from a water depth of250 m (Fig. 11).
As for the shallow-calcifying foraminifera, the
residuals of the deep-calcifying foraminifera also
display overestimated low temperatures and underestimated high temperatures. It can be assumed that
some outliers, especially in the temperature field
> 10° C, resulted from a incongruence between the
main season of species flux and selected temperatures in the Subtropical Gyre.
The temperature gradient in the upper 250 m
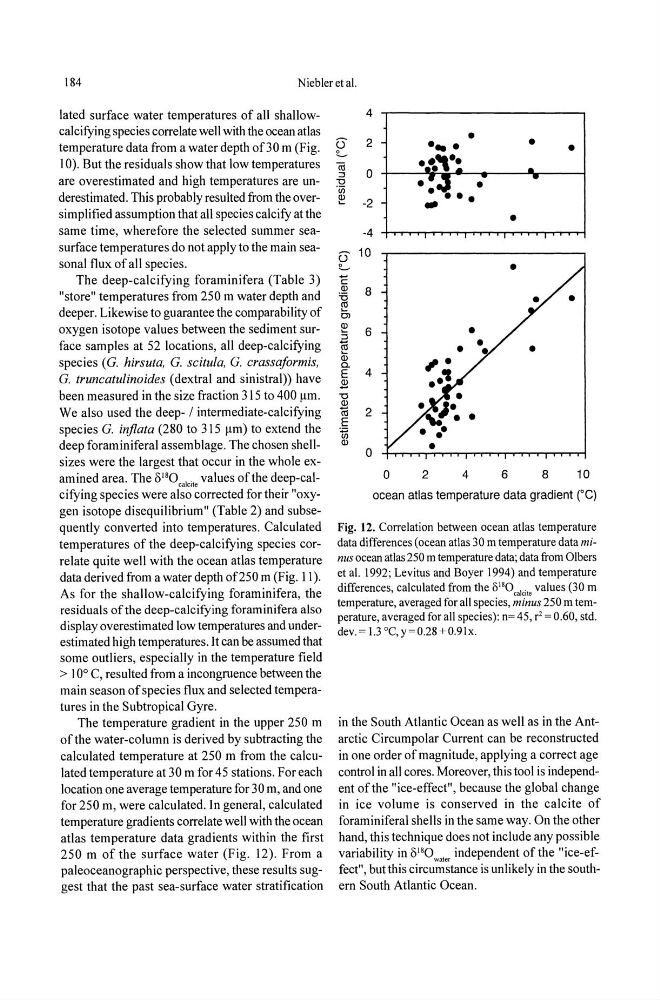
of the water-column is derived by subtracting the
calculated temperature at 250 m from the calculated temperature at 30 m for 45 stations. For each
location one average temperature for 30 m, and one
for 250 m, were calculated. In general, calculated
temperature gradients correlate well with the ocean
atlas temperature data gradients within the first
250 m of the surface water (Fig. 12). From a
paleoceanographic perspective, these results suggest that the past sea-surface water stratification
~
(ij
OJ
'0
'iii
~
LC
OJ
'0
~
OJ
~
OJ
~ OJ
a.
E
.l!l
'0
OJ
iii
E
.~
OJ
4
2
0
-2
-4
10
8
6
4
2
0
0
•
•• -'I
•
......
- .
2
4
• •
•
-
•
6
8
10
ocean atlas temperature data gradient (0C)
Fig. 12. Correlation between ocean atlas temperature
data differences (ocean atlas 30 m temperature data minus ocean atlas 250 m temperature data; data from Olbers
et al. 1992; Levitus and Boyer 1994) and temperature
differences, calculated from the 6 18 0"loile values (30 m
temperature, averaged for all species, minus 250 m temperature, averaged for all species): n= 45, r' = 0.60, std.
dev.= 1.3 °C,y=0.28+0.9Ix.
in the South Atlantic Ocean as well as in the Antarctic Circumpolar Current can be reconstructed
in one order of magnitude, applying a correct age
control in all cores. Moreover, this tool is independent of the "ice-effect", because the global change
in ice volume is conserved in the calcite of
foraminiferal shells in the same way. On the other
hand, this technique does not include any possible
variability in oJ'Ow.te< independent of the "ice-effect", but this circumstance is unlikely in the southern South Atlantic Ocean.
Niebler et al.
lated surface water temperatures of all shallowcalcifYing species correlate well with the ocean atlas
temperature data from a water depth ono m (Fig.
10). But the residuals show that low temperatures
are overestimated and high temperatures are underestimated. This probably resulted from the oversimplified assumption that all species calcifY atthe
same time, wherefore the selected summer seasurface temperatures do not apply to the main seasonal flux of all species.
The deep-calcifying foraminifera (Table 3)
"store" temperatures from 250 m water depth and
deeper. Likewise to guarantee the comparability of
oxygen isotope values between the sediment surface samples at 52 locations, all deep-calcifying
species (G. hirsuta, G. scitula, G. crassaformis,
G. truncatulinoides (dextral and sinistral)) have
been measured in the size fraction 315 to 400 Ilm.
We also used the deep- I intermediate-calcifYing
species G. inflata (280 to 315 Ilm) to extend the
deep foraminiferal assemblage. The chosen shellsizes were the largest that occur in the whole examined area. The oJ80o.loite values of the deep-calcifying species were also corrected for their "oxy_
gen isotope disequilibrium" (Table 2) and subsequently converted into temperatures. Calculated
temperatures of the deep-calcifYing species correlate quite well with the ocean atlas temperature
data derived from a water depth of250 m (Fig. 11).
As for the shallow-calcifying foraminifera, the
residuals of the deep-calcifying foraminifera also
display overestimated low temperatures and underestimated high temperatures. It can be assumed that
some outliers, especially in the temperature field
> 10° C, resulted from a incongruence between the
main season of species flux and selected temperatures in the Subtropical Gyre.
The temperature gradient in the upper 250 m
of the water-column is derived by subtracting the
calculated temperature at 250 m from the calculated temperature at 30 m for 45 stations. For each
location one average temperature for 30 m, and one
for 250 m, were calculated. In general, calculated
temperature gradients correlate well with the ocean
atlas temperature data gradients within the first
250 m of the surface water (Fig. 12). From a
paleoceanographic perspective, these results suggest that the past sea-surface water stratification
~
(ij
OJ
'0
'iii
~
LC
OJ
'0
~
OJ
~
OJ
~ OJ
a.
E
.l!l
'0
OJ
iii
E
.~
OJ
4
2
0
-2
-4
10
8
6
4
2
0
0
•
•• -'I
•
......
- .
2
4
• •
•
-
•
6
8
10
ocean atlas temperature data gradient (0C)
Fig. 12. Correlation between ocean atlas temperature
data differences (ocean atlas 30 m temperature data minus ocean atlas 250 m temperature data; data from Olbers
et al. 1992; Levitus and Boyer 1994) and temperature
differences, calculated from the 6 18 0"loile values (30 m
temperature, averaged for all species, minus 250 m temperature, averaged for all species): n= 45, r' = 0.60, std.
dev.= 1.3 °C,y=0.28+0.9Ix.
in the South Atlantic Ocean as well as in the Antarctic Circumpolar Current can be reconstructed
in one order of magnitude, applying a correct age
control in all cores. Moreover, this tool is independent of the "ice-effect", because the global change
in ice volume is conserved in the calcite of
foraminiferal shells in the same way. On the other
hand, this technique does not include any possible
variability in oJ'Ow.te< independent of the "ice-effect", but this circumstance is unlikely in the southern South Atlantic Ocean.