

The Distribution of Living Planktic Foraminifera in Relation to Southeast Atlantic Oceanography
III
8 18 0 (%0)
8 18 0 (%0)
2
0
-1
-2
-3
2
0
-1
-2
-3
0
rtm
a
tw
100
10
g 200
200
.!:
a. 300
Q)
300
"'C
400
400
cr
MN 1404 a)
MN 1405 b)
500
500
8 18 0 (%0)
8 ' 8 0 (%0)
2
0
-1
-2
-3
a
2
a
-1
-2
-3
wt
0
I
I
100
".....
E
d
'-'
.!:
-
30
a.
Ql
"'C
MN 1406 c)
MN 1407 d)
s
p
cr
m
d
w
G. siphomfera
H. pe/agica G. crassafonnis G menardii
G. ruber (r.) N. dutertrei G. ruber (.v.) G. tli/obus
•
.._._.---_ ....... -... _ ... -
3 1 80 calculated with
3180 calculated with sampled depth
auxiliary line to infer
8180-salinily relation
a 18 0 sea water
interval
the calcification depth
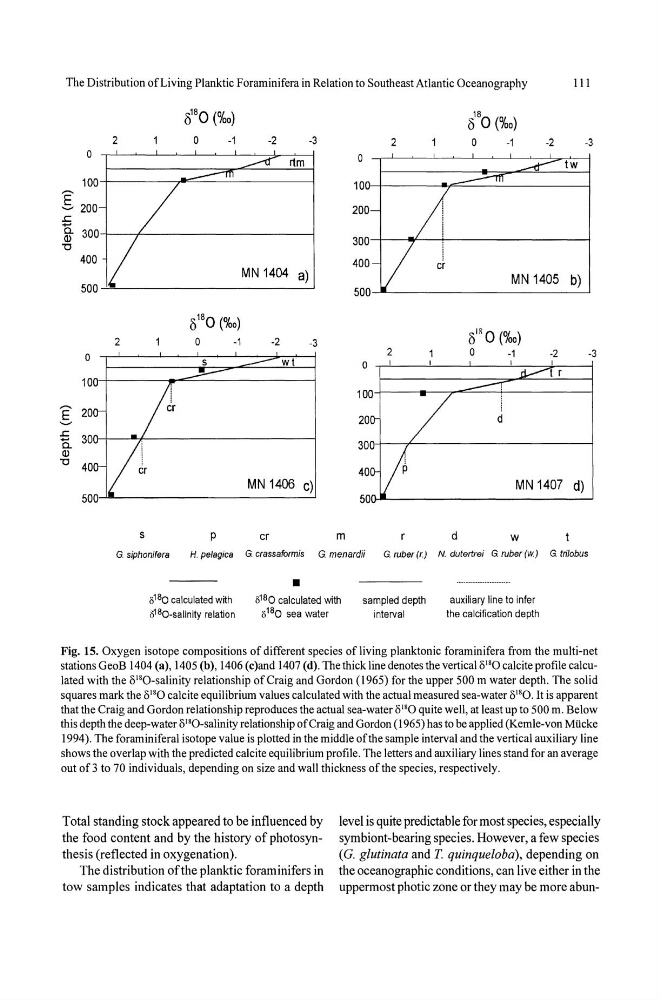
Fig. 15. Oxygen isotope compositions of different species of living planktonic foraminifera from the multi-net
stations GeoB 1404 (8), 1405 (b), 1406 (c)and 1407 (d). The thick line denotes the vertical 0 1 '0 calcite profile calculated with the ol'O-saiinity relationship of Craig and Gordon (1965) for the upper 500 m water depth. The solid
squares mark the 0 1 '0 calcite equilibrium values calculated with the actual measured sea-water 0180. It is apparent
that the Craig and Gordon relationship reproduces the actual sea-water olgO quite well, at least up to 500 m. Below
this depth the deep-water ol'O-salinity relationship of Craig and Gordon (1965) has to be applied (Kemle-von Mucke
1994). The foraminiferal isotope value is plotted in the middle ofthe sample interval and the vertical auxiliary line
shows the overlap with the predicted calcite equilibrium profile. The letters and auxiliary lines stand for an average
out of3 to 70 individuals, depending on size and wall thickness of the species, respectively.
Total standing stock appeared to be influenced by
the food content and by the history of photosynthesis (reflected in oxygenation).
The distribution ofthe planktic foraminifers in
tow samples indicates that adaptation to a depth
level is quite predictable for most species, especially
symbiont-bearing species. However, a few species
(G. glutinata and T. quinquelaba), depending on
the oceanographic conditions, can live either in the
uppermost photic zone or they may be more abun-
III
8 18 0 (%0)
8 18 0 (%0)
2
0
-1
-2
-3
2
0
-1
-2
-3
0
rtm
a
tw
100
10
g 200
200
.!:
a. 300
Q)
300
"'C
400
400
cr
MN 1404 a)
MN 1405 b)
500
500
8 18 0 (%0)
8 ' 8 0 (%0)
2
0
-1
-2
-3
a
2
a
-1
-2
-3
wt
0
I
I
100
".....
E
d
'-'
.!:
-
30
a.
Ql
"'C
MN 1406 c)
MN 1407 d)
s
p
cr
m
d
w
G. siphomfera
H. pe/agica G. crassafonnis G menardii
G. ruber (r.) N. dutertrei G. ruber (.v.) G. tli/obus
•
.._._.---_ ....... -... _ ... -
3 1 80 calculated with
3180 calculated with sampled depth
auxiliary line to infer
8180-salinily relation
a 18 0 sea water
interval
the calcification depth
Fig. 15. Oxygen isotope compositions of different species of living planktonic foraminifera from the multi-net
stations GeoB 1404 (8), 1405 (b), 1406 (c)and 1407 (d). The thick line denotes the vertical 0 1 '0 calcite profile calculated with the ol'O-saiinity relationship of Craig and Gordon (1965) for the upper 500 m water depth. The solid
squares mark the 0 1 '0 calcite equilibrium values calculated with the actual measured sea-water 0180. It is apparent
that the Craig and Gordon relationship reproduces the actual sea-water olgO quite well, at least up to 500 m. Below
this depth the deep-water ol'O-salinity relationship of Craig and Gordon (1965) has to be applied (Kemle-von Mucke
1994). The foraminiferal isotope value is plotted in the middle ofthe sample interval and the vertical auxiliary line
shows the overlap with the predicted calcite equilibrium profile. The letters and auxiliary lines stand for an average
out of3 to 70 individuals, depending on size and wall thickness of the species, respectively.
Total standing stock appeared to be influenced by
the food content and by the history of photosynthesis (reflected in oxygenation).
The distribution ofthe planktic foraminifers in
tow samples indicates that adaptation to a depth
level is quite predictable for most species, especially
symbiont-bearing species. However, a few species
(G. glutinata and T. quinquelaba), depending on
the oceanographic conditions, can live either in the
uppermost photic zone or they may be more abun-