

Part A | 2.9
44 Part A Fundamentals
ρ''
u''
u'
a
26.4
26.45
26.5
26.55
26.6
h''
h'
ρ'
c
c
a)
Hourly intervals
b) Depth (m)
20
40
60
80
100
120
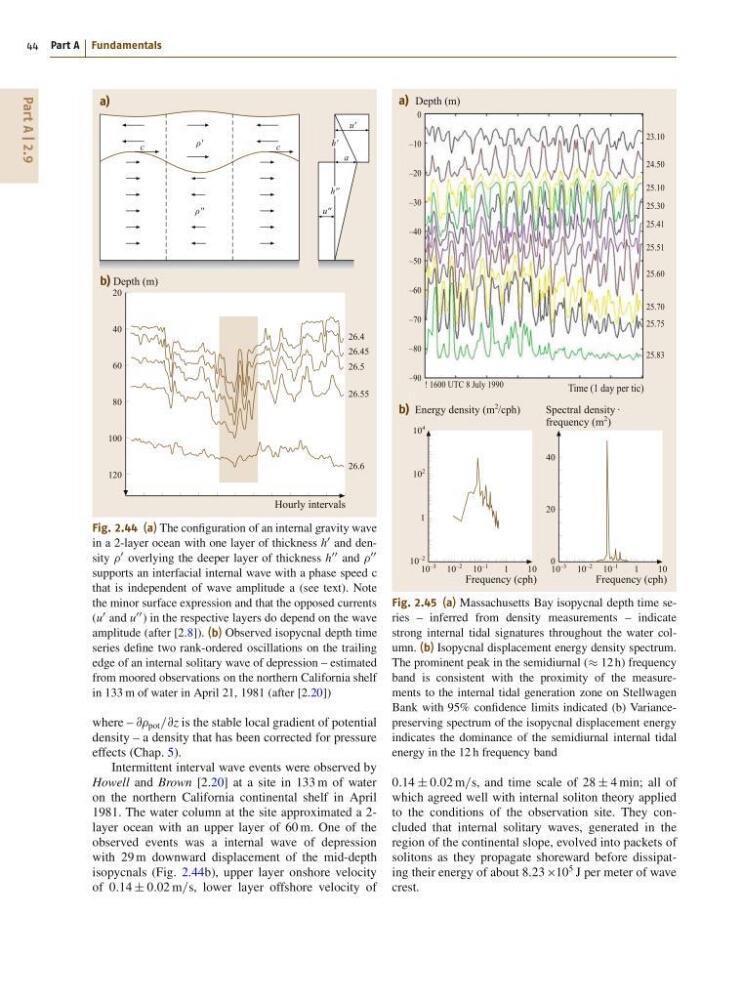
Fig. 2.44 (a) The configuration of an internal gravity wave
in a 2-layer ocean with one layer of thickness h
0 and density
0 overlying the deeper layer of thickness h
00 and
00
supports an interfacial internal wave with a phase speed c
that is independent of wave amplitude a (see text). Note
the minor surface expression and that the opposed currents
(u
0 and u
00 ) in the respective layers do depend on the wave
amplitude (after [2.8]). (b) Observed isopycnal depth time
series define two rank-ordered oscillations on the trailing
edge of an internal solitary wave of depression – estimated
from moored observations on the northern California shelf
in 133 m of water in April 21, 1981 (after [2.20])
where – @@ pot =@z is the stable local gradient of potential
density – a density that has been corrected for pressure
effects (Chap. 5).
Intermittent interval wave events were observed by
Howell and Brown [2.20] at a site in 133 m of water
on the northern California continental shelf in April
1981. The water column at the site approximated a 2layer ocean with an upper layer of 60 m. One of the
observed events was a internal wave of depression
with 29 m downward displacement of the mid-depth
isopycnals (Fig. 2.44b), upper layer onshore velocity
of 0:14 ˙ 0:02 m=s, lower layer offshore velocity of
! 1600 UTC 8 July 1990
23.10
24.50
25.10
25.30
25.41
25.51
25.60
25.70
25.75
25.83
a) Depth (m)
b) Energy density (m
2
/cph)
Time (1 day per tic)
0
–10
–20
–30
–40
–50
–60
–70
–80
–90
10
–3
10
–2
10
–1
1
1 0
Frequency (cph)
10
–3
10
–2
10
–1
1
1 0
Frequency (cph)
10
4
10
2
1
10
–2
Spectral density ·
frequency (m
2
)
40
20
0
Fig. 2.45 (a) Massachusetts Bay isopycnal depth time series – inferred from density measurements – indicate
strong internal tidal signatures throughout the water column. (b) Isopycnal displacement energy density spectrum.
The prominent peak in the semidiurnal ( 12 h) frequency
band is consistent with the proximity of the measurements to the internal tidal generation zone on Stellwagen
Bank with 95% confidence limits indicated (b) Variancepreserving spectrum of the isopycnal displacement energy
indicates the dominance of the semidiurnal internal tidal
energy in the 12 h frequency band
0:14 ˙ 0:02 m=s, and time scale of 28 ˙ 4 min; all of
which agreed well with internal soliton theory applied
to the conditions of the observation site. They concluded that internal solitary waves, generated in the
region of the continental slope, evolved into packets of
solitons as they propagate shoreward before dissipating their energy of about 8:23 10
5 J per meter of wave
crest.
44 Part A Fundamentals
ρ''
u''
u'
a
26.4
26.45
26.5
26.55
26.6
h''
h'
ρ'
c
c
a)
Hourly intervals
b) Depth (m)
20
40
60
80
100
120
Fig. 2.44 (a) The configuration of an internal gravity wave
in a 2-layer ocean with one layer of thickness h
0 and density
0 overlying the deeper layer of thickness h
00 and
00
supports an interfacial internal wave with a phase speed c
that is independent of wave amplitude a (see text). Note
the minor surface expression and that the opposed currents
(u
0 and u
00 ) in the respective layers do depend on the wave
amplitude (after [2.8]). (b) Observed isopycnal depth time
series define two rank-ordered oscillations on the trailing
edge of an internal solitary wave of depression – estimated
from moored observations on the northern California shelf
in 133 m of water in April 21, 1981 (after [2.20])
where – @@ pot =@z is the stable local gradient of potential
density – a density that has been corrected for pressure
effects (Chap. 5).
Intermittent interval wave events were observed by
Howell and Brown [2.20] at a site in 133 m of water
on the northern California continental shelf in April
1981. The water column at the site approximated a 2layer ocean with an upper layer of 60 m. One of the
observed events was a internal wave of depression
with 29 m downward displacement of the mid-depth
isopycnals (Fig. 2.44b), upper layer onshore velocity
of 0:14 ˙ 0:02 m=s, lower layer offshore velocity of
! 1600 UTC 8 July 1990
23.10
24.50
25.10
25.30
25.41
25.51
25.60
25.70
25.75
25.83
a) Depth (m)
b) Energy density (m
2
/cph)
Time (1 day per tic)
0
–10
–20
–30
–40
–50
–60
–70
–80
–90
10
–3
10
–2
10
–1
1
1 0
Frequency (cph)
10
–3
10
–2
10
–1
1
1 0
Frequency (cph)
10
4
10
2
1
10
–2
Spectral density ·
frequency (m
2
)
40
20
0
Fig. 2.45 (a) Massachusetts Bay isopycnal depth time series – inferred from density measurements – indicate
strong internal tidal signatures throughout the water column. (b) Isopycnal displacement energy density spectrum.
The prominent peak in the semidiurnal ( 12 h) frequency
band is consistent with the proximity of the measurements to the internal tidal generation zone on Stellwagen
Bank with 95% confidence limits indicated (b) Variancepreserving spectrum of the isopycnal displacement energy
indicates the dominance of the semidiurnal internal tidal
energy in the 12 h frequency band
0:14 ˙ 0:02 m=s, and time scale of 28 ˙ 4 min; all of
which agreed well with internal soliton theory applied
to the conditions of the observation site. They concluded that internal solitary waves, generated in the
region of the continental slope, evolved into packets of
solitons as they propagate shoreward before dissipating their energy of about 8:23 10
5 J per meter of wave
crest.