

Part C | 30.3
676 Part C Coastal Design
0
0.5
1
1.5
2
2.5
3
3.5
Y/d s
East Harbor
Lakeshore Park
Lakeview Park
Castlewood Park
Holly Beach
Central Beach
Presque Isle (H)
Presque Isle (L)
Winthrop Beach (H)
Winthrop Beach (L)
N o s i n o u s i t y
S a l i e n t s
T o m b o l o s
?
?
?
?
?
?
?
?
?
?
L s /L g
80
70
60
50
40
30
20
10
0
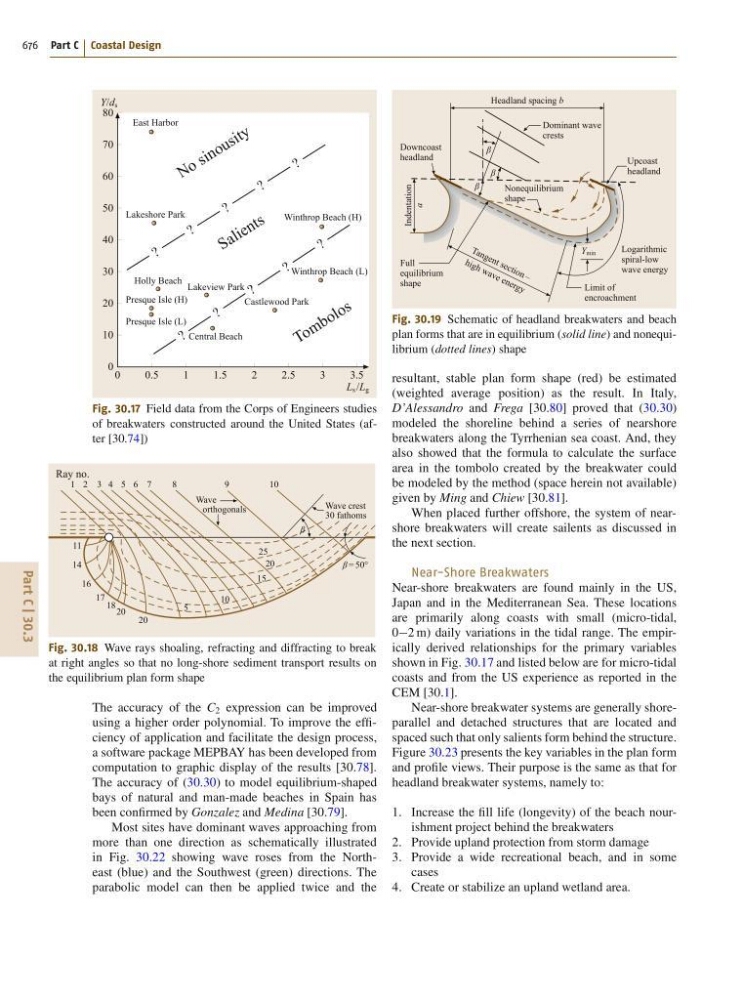
Fig. 30.17 Field data from the Corps of Engineers studies
of breakwaters constructed around the United States (after [30.74])
Ray no.
Wave
orthogonals
Wave crest
30 fathoms
β = 50°
β
1 2 3 4 5 6 7
8
9
10
11
14
16
17 18 20
20
5
10
15
20
25
Fig. 30.18 Wave rays shoaling, refracting and diffracting to break
at right angles so that no long-shore sediment transport results on
the equilibrium plan form shape
The accuracy of the C 2 expression can be improved
using a higher order polynomial. To improve the efficiency of application and facilitate the design process,
a software package MEPBAY has been developed from
computation to graphic display of the results [30.78].
The accuracy of (30.30) to model equilibrium-shaped
bays of natural and man-made beaches in Spain has
been confirmed by Gonzalez and Medina [30.79].
Most sites have dominant waves approaching from
more than one direction as schematically illustrated
in Fig. 30.22 showing wave roses from the Northeast (blue) and the Southwest (green) directions. The
parabolic model can then be applied twice and the
Dominant wave
crests
Nonequilibrium
shape
T a n g e n t s e c ti o n –
h ig h w a v e e n e rg y
Upcoast
headland
Downcoast
headland
Full
equilibrium
shape
Indentation
a
Logarithmic
spiral-low
wave energy
Y min
β
β
β
Limit of
encroachment
Headland spacing b
Fig. 30.19 Schematic of headland breakwaters and beach
plan forms that are in equilibrium (solid line) and nonequilibrium (dotted lines) shape
resultant, stable plan form shape (red) be estimated
(weighted average position) as the result. In Italy,
D’Alessandro and Frega [30.80] proved that (30.30)
modeled the shoreline behind a series of nearshore
breakwaters along the Tyrrhenian sea coast. And, they
also showed that the formula to calculate the surface
area in the tombolo created by the breakwater could
be modeled by the method (space herein not available)
given by Ming and Chiew [30.81].
When placed further offshore, the system of nearshore breakwaters will create sailents as discussed in
the next section.
Near-Shore Breakwaters
Near-shore breakwaters are found mainly in the US,
Japan and in the Mediterranean Sea. These locations
are primarily along coasts with small (micro-tidal,
02 m) daily variations in the tidal range. The empirically derived relationships for the primary variables
shown in Fig. 30.17 and listed below are for micro-tidal
coasts and from the US experience as reported in the
CEM [30.1].
Near-shore breakwater systems are generally shoreparallel and detached structures that are located and
spaced such that only salients form behind the structure.
Figure 30.23 presents the key variables in the plan form
and profile views. Their purpose is the same as that for
headland breakwater systems, namely to:
1. Increase the fill life (longevity) of the beach nourishment project behind the breakwaters
2. Provide upland protection from storm damage
3. Provide a wide recreational beach, and in some
cases
4. Create or stabilize an upland wetland area.