

Storm Hazard Mitigation Structures 30.1 Design Criteria, Philosophy, and Constraints 655
Part C | 30.1
30.1 Design Criteria, Philosophy, and Constraints
30.1.1 Water Levels
Water depth is arguably the most important independent variable in coastal structure design. By definition,
the structure is at or near the land–water interface (the
coast) where shallow water depths limit the wave height
due to wave breaking. Low pressure storms and hurricanes with strong winds create storm surge that can
significantly increase the local water depths during the
storm event. Larger storm waves result before breaking depths are again attained and result in higher loads
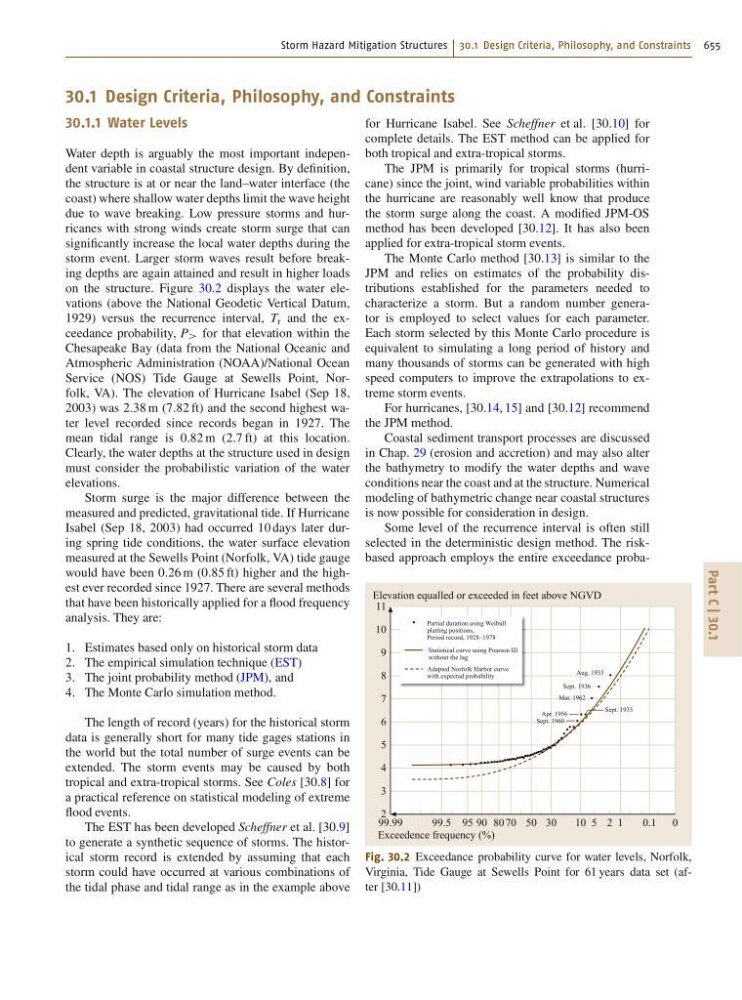
on the structure. Figure 30.2 displays the water elevations (above the National Geodetic Vertical Datum,
1929) versus the recurrence interval, T r and the exceedance probability, P > for that elevation within the
Chesapeake Bay (data from the National Oceanic and
Atmospheric Administration (NOAA)/National Ocean
Service (NOS) Tide Gauge at Sewells Point, Norfolk, VA). The elevation of Hurricane Isabel (Sep 18,
2003) was 2:38 m (7:82 ft) and the second highest water level recorded since records began in 1927. The
mean tidal range is 0:82 m (2:7 ft) at this location.
Clearly, the water depths at the structure used in design
must consider the probabilistic variation of the water
elevations.
Storm surge is the major difference between the
measured and predicted, gravitational tide. If Hurricane
Isabel (Sep 18, 2003) had occurred 10 days later during spring tide conditions, the water surface elevation
measured at the Sewells Point (Norfolk, VA) tide gauge
would have been 0:26 m (0:85 ft) higher and the highest ever recorded since 1927. There are several methods
that have been historically applied for a flood frequency
analysis. They are:
1. Estimates based only on historical storm data
2. The empirical simulation technique (EST)
3. The joint probability method (JPM), and
4. The Monte Carlo simulation method.
The length of record (years) for the historical storm
data is generally short for many tide gages stations in
the world but the total number of surge events can be
extended. The storm events may be caused by both
tropical and extra-tropical storms. See Coles [30.8] for
a practical reference on statistical modeling of extreme
flood events.
The EST has been developed Scheffner et al. [30.9]
to generate a synthetic sequence of storms. The historical storm record is extended by assuming that each
storm could have occurred at various combinations of
the tidal phase and tidal range as in the example above
for Hurricane Isabel. See Scheffner et al. [30.10] for
complete details. The EST method can be applied for
both tropical and extra-tropical storms.
The JPM is primarily for tropical storms (hurricane) since the joint, wind variable probabilities within
the hurricane are reasonably well know that produce
the storm surge along the coast. A modified JPM-OS
method has been developed [30.12]. It has also been
applied for extra-tropical storm events.
The Monte Carlo method [30.13] is similar to the
JPM and relies on estimates of the probability distributions established for the parameters needed to
characterize a storm. But a random number generator is employed to select values for each parameter.
Each storm selected by this Monte Carlo procedure is
equivalent to simulating a long period of history and
many thousands of storms can be generated with high
speed computers to improve the extrapolations to extreme storm events.
For hurricanes, [30.14, 15] and [30.12] recommend
the JPM method.
Coastal sediment transport processes are discussed
in Chap. 29 (erosion and accretion) and may also alter
the bathymetry to modify the water depths and wave
conditions near the coast and at the structure. Numerical
modeling of bathymetric change near coastal structures
is now possible for consideration in design.
Some level of the recurrence interval is often still
selected in the deterministic design method. The riskbased approach employs the entire exceedance probaPartial duration using Weibull
platting positions,
Period record, 1928–1978
Statistical curve using Poarson III
without the lag
Adapted Norfolk Harbor curve
with expectad probability
Aug. 1933
Sept. 1936
Mar. 1962
Apr. 1956
Sept. 1960
Sept. 1933
99.99
99.5 95 90 80
50
70
30
10 5 2 1
0.1 0
Elevation equalled or exceeded in feet above NGVD
Exceedence frequency (%)
11
10
9
8
7
6
5
4
3
2
Fig. 30.2 Exceedance probability curve for water levels, Norfolk,
Virginia, Tide Gauge at Sewells Point for 61 years data set (after [30.11])