

Beach Nourishment 29.6 Legacy Beach Nourishment Projects 647
Part C | 29.6
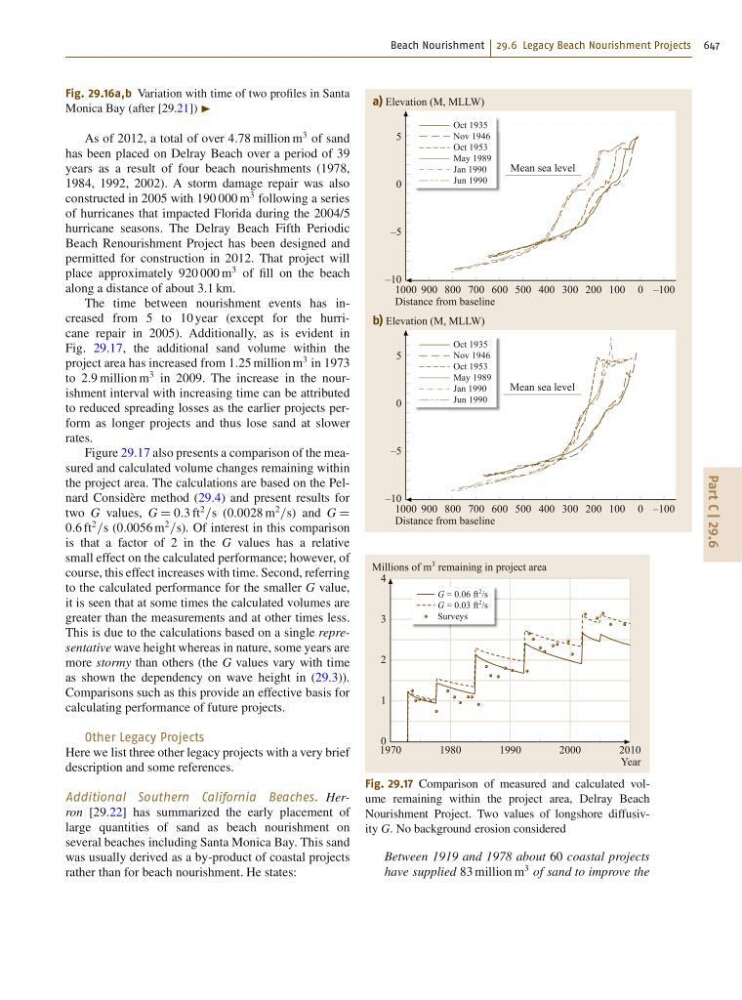
Fig. 29.16a,b Variation with time of two profiles in Santa
Monica Bay (after [29.21]) I
As of 2012, a total of over 4:78 million m
3 of sand
has been placed on Delray Beach over a period of 39
years as a result of four beach nourishments (1978,
1984, 1992, 2002). A storm damage repair was also
constructed in 2005 with 190 000 m
3 following a series
of hurricanes that impacted Florida during the 2004/5
hurricane seasons. The Delray Beach Fifth Periodic
Beach Renourishment Project has been designed and
permitted for construction in 2012. That project will
place approximately 920 000 m
3 of fill on the beach
along a distance of about 3:1 km.
The time between nourishment events has increased from 5 to 10 year (except for the hurricane repair in 2005). Additionally, as is evident in
Fig. 29.17, the additional sand volume within the
project area has increased from 1:25 million m
3 in 1973
to 2:9 million m
3 in 2009. The increase in the nourishment interval with increasing time can be attributed
to reduced spreading losses as the earlier projects perform as longer projects and thus lose sand at slower
rates.
Figure 29.17 also presents a comparison of the measured and calculated volume changes remaining within
the project area. The calculations are based on the Pelnard Considère method (29.4) and present results for
two G values, G D 0:3 ft
2
=s (0:0028 m
2
=s) and G D
0:6 ft
2
=s (0:0056 m
2
=s). Of interest in this comparison
is that a factor of 2 in the G values has a relative
small effect on the calculated performance; however, of
course, this effect increases with time. Second, referring
to the calculated performance for the smaller G value,
it is seen that at some times the calculated volumes are
greater than the measurements and at other times less.
This is due to the calculations based on a single representative wave height whereas in nature, some years are
more stormy than others (the G values vary with time
as shown the dependency on wave height in (29.3)).
Comparisons such as this provide an effective basis for
calculating performance of future projects.
Other Legacy Projects
Here we list three other legacy projects with a very brief
description and some references.
Additional Southern California Beaches. Herron [29.22] has summarized the early placement of
large quantities of sand as beach nourishment on
several beaches including Santa Monica Bay. This sand
was usually derived as a by-product of coastal projects
rather than for beach nourishment. He states:
Oct 1935
Nov 1946
Oct 1953
May 1989
Jan 1990
Jun 1990
Oct 1935
Nov 1946
Oct 1953
May 1989
Jan 1990
Jun 1990
1000 900 800 700 600 500
Mean sea level
400 300 200 100 0 –100
a) Elevation (M, MLLW)
Distance from baseline
5
0
–5
–10
1000 900 800 700 600 500
Mean sea level
400 300 200 100 0 –100
b) Elevation (M, MLLW)
Distance from baseline
5
0
–5
–10
G = 0.06 ft
2 /s
G = 0.03 ft
2 /s
Surveys
1970
1980
1990
2000
2010
Millions of m
3 remaining in project area
Year
4
3
2
1
0
Fig. 29.17 Comparison of measured and calculated volume remaining within the project area, Delray Beach
Nourishment Project. Two values of longshore diffusivity G. No background erosion considered
Between 1919 and 1978 about 60 coastal projects
have supplied 83 million m
3 of sand to improve the