

Beach Nourishment 29.6 Legacy Beach Nourishment Projects 645
Part C | 29.6
Ad hoc
transformation
a)
b)
Shoreline
Initial actual shoreline
and contours
Initial shoreline and
contours to be modeled
Contours
Shoreline
Contours
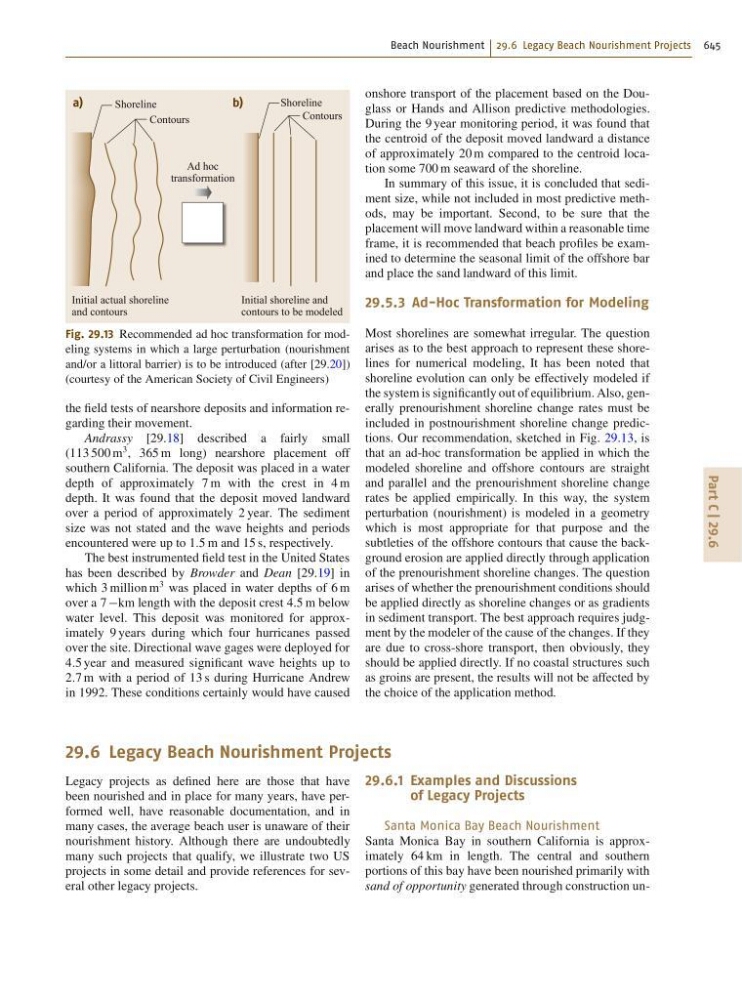
Fig. 29.13 Recommended ad hoc transformation for modeling systems in which a large perturbation (nourishment
and/or a littoral barrier) is to be introduced (after [29.20])
(courtesy of the American Society of Civil Engineers)
the field tests of nearshore deposits and information regarding their movement.
Andrassy [29.18] described a fairly small
(113 500 m
3 , 365 m long) nearshore placement off
southern California. The deposit was placed in a water
depth of approximately 7 m with the crest in 4 m
depth. It was found that the deposit moved landward
over a period of approximately 2 year. The sediment
size was not stated and the wave heights and periods
encountered were up to 1:5 m and 15 s, respectively.
The best instrumented field test in the United States
has been described by Browder and Dean [29.19] in
which 3 million m
3 was placed in water depths of 6 m
over a 7 km length with the deposit crest 4:5 m below
water level. This deposit was monitored for approximately 9 years during which four hurricanes passed
over the site. Directional wave gages were deployed for
4:5 year and measured significant wave heights up to
2:7 m with a period of 13 s during Hurricane Andrew
in 1992. These conditions certainly would have caused
onshore transport of the placement based on the Douglass or Hands and Allison predictive methodologies.
During the 9 year monitoring period, it was found that
the centroid of the deposit moved landward a distance
of approximately 20 m compared to the centroid location some 700 m seaward of the shoreline.
In summary of this issue, it is concluded that sediment size, while not included in most predictive methods, may be important. Second, to be sure that the
placement will move landward within a reasonable time
frame, it is recommended that beach profiles be examined to determine the seasonal limit of the offshore bar
and place the sand landward of this limit.
29.5.3 Ad-Hoc Transformation for Modeling
Most shorelines are somewhat irregular. The question
arises as to the best approach to represent these shorelines for numerical modeling, It has been noted that
shoreline evolution can only be effectively modeled if
the system is significantly out of equilibrium. Also, generally prenourishment shoreline change rates must be
included in postnourishment shoreline change predictions. Our recommendation, sketched in Fig. 29.13, is
that an ad-hoc transformation be applied in which the
modeled shoreline and offshore contours are straight
and parallel and the prenourishment shoreline change
rates be applied empirically. In this way, the system
perturbation (nourishment) is modeled in a geometry
which is most appropriate for that purpose and the
subtleties of the offshore contours that cause the background erosion are applied directly through application
of the prenourishment shoreline changes. The question
arises of whether the prenourishment conditions should
be applied directly as shoreline changes or as gradients
in sediment transport. The best approach requires judgment by the modeler of the cause of the changes. If they
are due to cross-shore transport, then obviously, they
should be applied directly. If no coastal structures such
as groins are present, the results will not be affected by
the choice of the application method.
29.6 Legacy Beach Nourishment Projects
Legacy projects as defined here are those that have
been nourished and in place for many years, have performed well, have reasonable documentation, and in
many cases, the average beach user is unaware of their
nourishment history. Although there are undoubtedly
many such projects that qualify, we illustrate two US
projects in some detail and provide references for several other legacy projects.
29.6.1 Examples and Discussions
of Legacy Projects
Santa Monica Bay Beach Nourishment
Santa Monica Bay in southern California is approximately 64 km in length. The central and southern
portions of this bay have been nourished primarily with
sand of opportunity generated through construction un-