

Part C | 29.5
644 Part C Coastal Design
08/1993
10/1993
02/1994
08/1994
02/1995
07/1997
03/1998
02/1999
9 11 13 15 17 19 21 23
Project area
25 27 29 31 33 35 37 39
Measured shoreline changes relative to as-built (ft)
Monument
150
100
50
0
–50
–100
–150
–200
–250
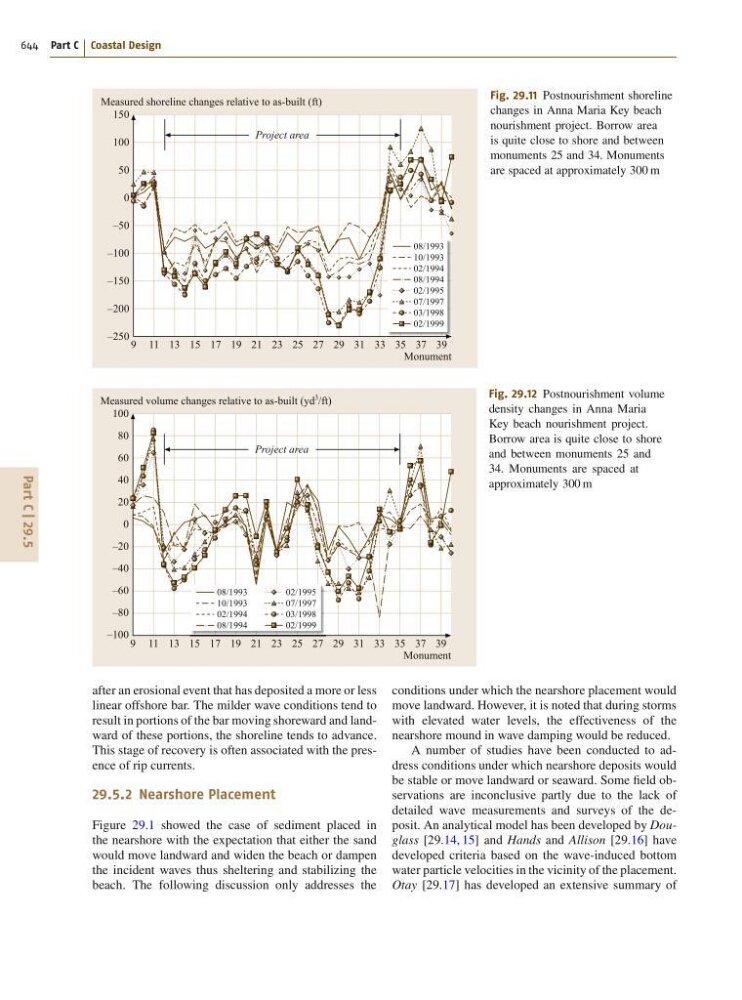
Fig. 29.11 Postnourishment shoreline
changes in Anna Maria Key beach
nourishment project. Borrow area
is quite close to shore and between
monuments 25 and 34. Monuments
are spaced at approximately 300 m
08/1993
10/1993
02/1994
08/1994
02/1995
07/1997
03/1998
02/1999
9 11 13 15 17 19 21 23
Project area
25 27 29 31 33 35 37 39
Measured volume changes relative to as-built (yd
3
/ft)
Monument
100
80
60
40
20
0
–20
–40
–60
–80
–100
Fig. 29.12 Postnourishment volume
density changes in Anna Maria
Key beach nourishment project.
Borrow area is quite close to shore
and between monuments 25 and
34. Monuments are spaced at
approximately 300 m
after an erosional event that has deposited a more or less
linear offshore bar. The milder wave conditions tend to
result in portions of the bar moving shoreward and landward of these portions, the shoreline tends to advance.
This stage of recovery is often associated with the presence of rip currents.
29.5.2 Nearshore Placement
Figure 29.1 showed the case of sediment placed in
the nearshore with the expectation that either the sand
would move landward and widen the beach or dampen
the incident waves thus sheltering and stabilizing the
beach. The following discussion only addresses the
conditions under which the nearshore placement would
move landward. However, it is noted that during storms
with elevated water levels, the effectiveness of the
nearshore mound in wave damping would be reduced.
A number of studies have been conducted to address conditions under which nearshore deposits would
be stable or move landward or seaward. Some field observations are inconclusive partly due to the lack of
detailed wave measurements and surveys of the deposit. An analytical model has been developed by Douglass [29.14, 15] and Hands and Allison [29.16] have
developed criteria based on the wave-induced bottom
water particle velocities in the vicinity of the placement.
Otay [29.17] has developed an extensive summary of